INCISO
(skip this section if you are only interested in the technical side of this blog post)
LinkedIn and X (formerly Twitter) have a massive influx of posts with super positive feedback related to Directions EMEA 2023 in Lyon. No worries, you have my 5+ stars too and chapeau to the organization committee. I was in the first Directions in Paris in 2008 (Torben Kragelund was already there, of course) and looking forward 15 years what has been built around this event, it is truly incredible. We all grown together and continue to be surprised at keynotes like kiddos entering an amusement park.
Personally, I have only one reflection.
In the US there is a user Community Summit North America (summitna.com) dedicated to who is practically using Dynamics 365 Business Central daily to “guadagnarsi la pagnotta” (literally, gain the deserved bread). Users are the frontline and the first to cry for happiness when a new feature is implemented, when a gap in their business process is solved, painfully suffering when performance drop or blow their socks off when they just learn a new keyboard shortcut to be more productive.
(Trust me. Developers and Users have many things in common. And like Tom & Jerry, they can’t leave far from each other.)

When I was working at customer side, there was also an event targeted to end-users and prospects called Convergence. That was the first time I felt the warm community vibes – the first edition in Munich had Bill Gates in person doing a speech and Satya Nadella was the Dynamics GM – . The driver was the pure desire from Microsoft to fulfill its customer obsessed paradigm and hear straight feedback directly from the user community.
@James Crowter, I bet you were in Munich too. Why not doing it once again?
@Product Group. We all want to move customers from legacy on-premises to the cloud heaven. Why not let them touch with hands, once again, the value of upgrade and take the leap to the cloud?
Good! After this digression, where I haven’t changed any single line from its draft, let’s get back to the main course. Below one of the scenarios taken from the session that Stefano Demiliani and I did few days ago in Lyon.
SCENARIO
It was that typical day where you were yawning and suddenly a ping: our printing is becoming slower and slower every day.
Imagine a Dynamics 365 Business Central online landscape where a discrete number of printers (100+) are continuously generating labels. What to print is set through API calls. External API calls are handled by a custom framework with a sexy retry logic within Dynamics 365 Business Central, to ensure that messages are processed. And none is left behind.
Where to start with the analysis? I am typically using a Top-Down and cyclic approach:
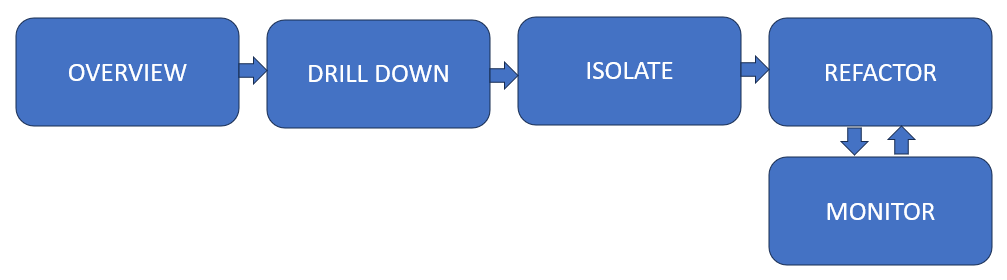
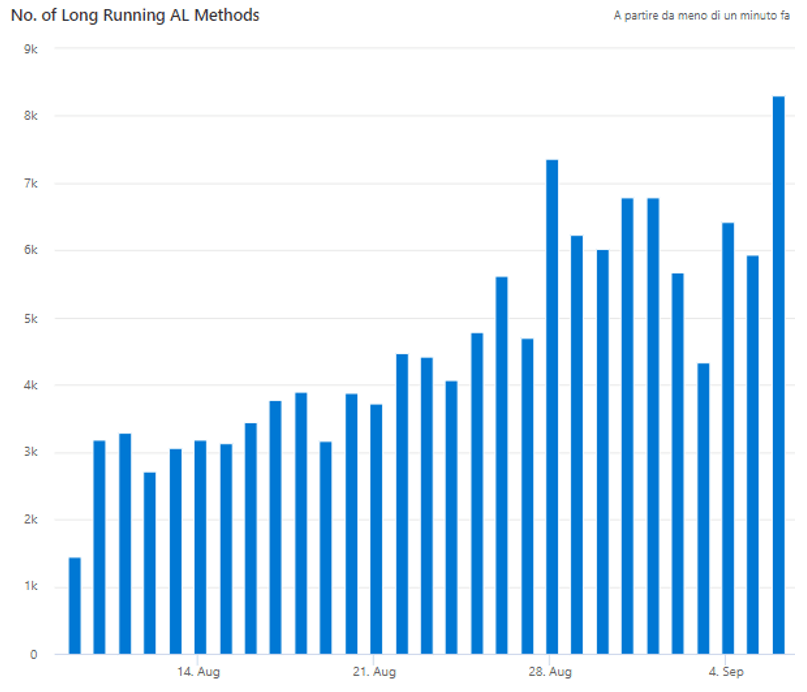
Overview
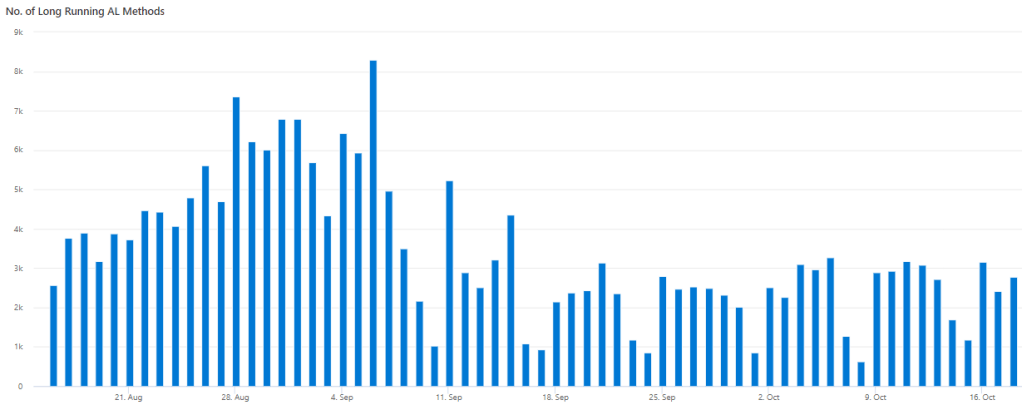
Within telemetries, we have implemented a dashboard with specific general statistics, tailored on customer critical business processes. By the time of the ping, everything was perfectly fine, except a trending growth in the number of Long Running AL Methods (LRAM).
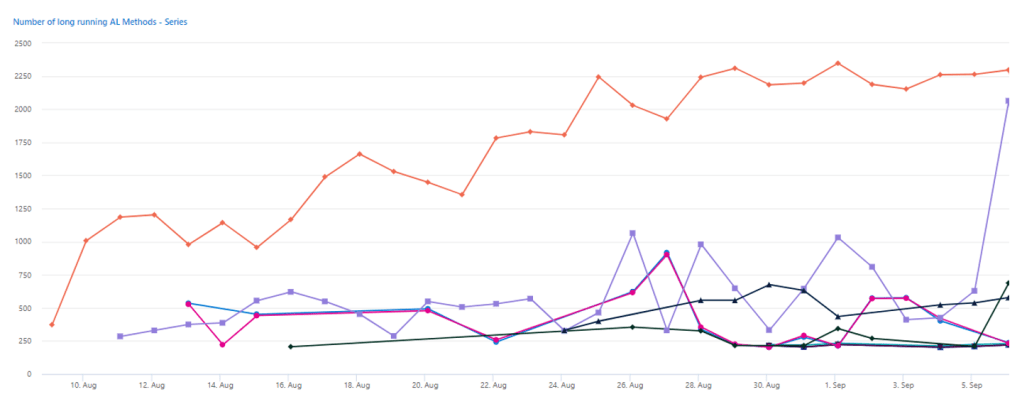
Drill Down
Summarizing LRAM per single object and filtering them with a specific count threshold, it was possible to analyze the individual trend.
| summarize count() by extensionId, extensionName, extensionPublisher, alObjectType, alObjectId, alObjectName, bin(timestamp, 1d)
| where count_ > 200
Immediately highlighting what was up in the trend: it was the bunch of AL objects involved in external API calls. E.g. the orange timeline is related to a custom object named “Send out – WS Call”.
Isolate: use specific signal(s)
Stated that LRAM increasing trend could be tightly related to Outgoing Web Service calls, we jumped into the specific signal (RT0019) analysis and checked all outgoing calls and their evolution over time, grouping them in 1 day buckets.
| summarize count() by httpStatusCode, type, method, endpoint, bin(timestamp,1d)
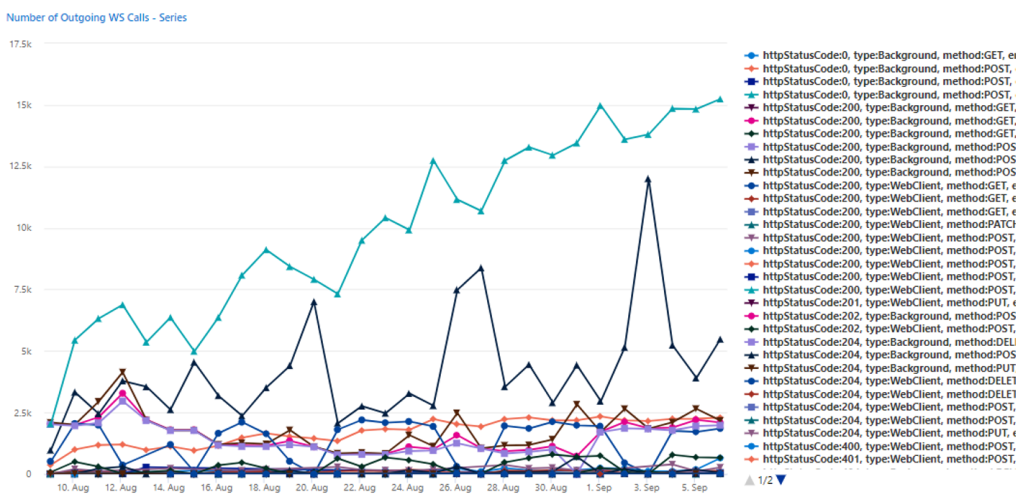
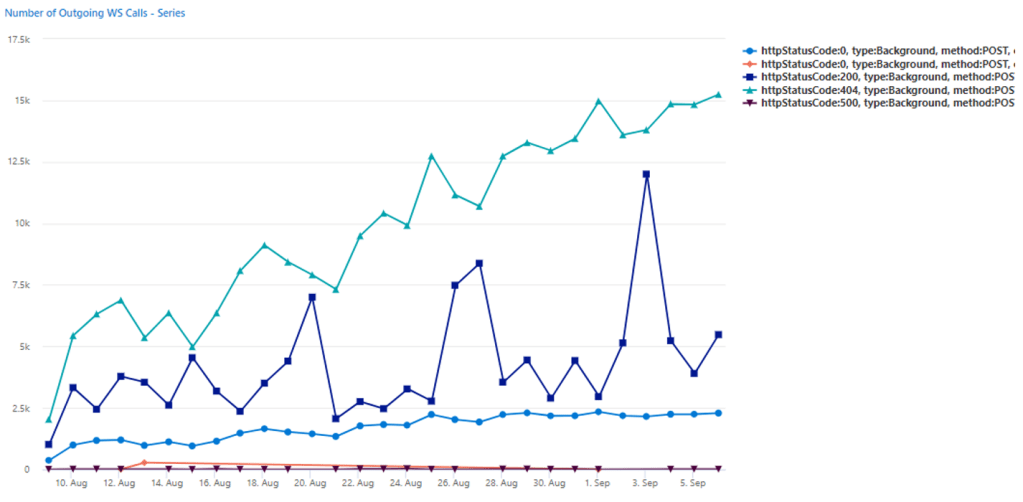
We have then filtered out all calls to a specific endpoint and their HTTP status code and concentrated only on background sessions, eliminating all the noises. Bingo! The result was a super-high increase day after day of HTTP 404 for a POST method to a specific endpoint.
| where type <> “WebClient”
| where endpoint contains “<Redacted>”
Refactor
Once we have found the endpoints and call behaviors, a code change has been committed, tested, and deployed to avoid further calls proliferation.
Monitor
The result was almost immediate within telemetries: a drastic drop to zero to the series of calls returning 0, 404 and 500, that was meaning no more uncontrolled outgoing web calls.
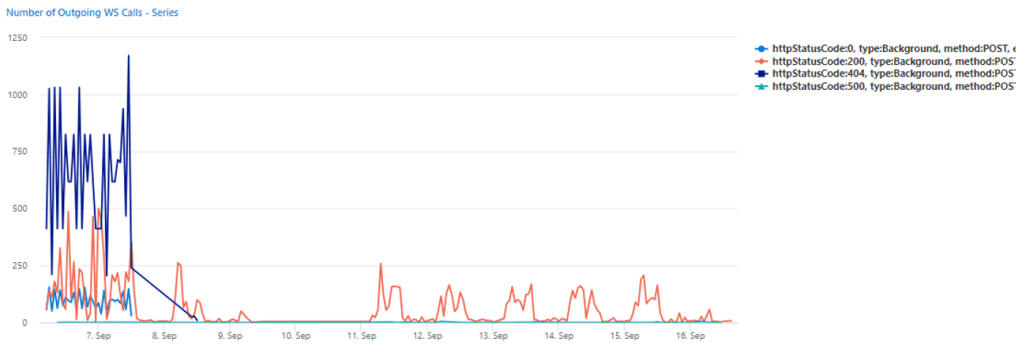
Consequently, also LRAM decreased and back to a steady shape, as they should be.
CONCLUSION AND TAKEAWAYS
In this SaaS real-life scenario (yes, it really happened) I could clearly demonstrate the value of having telemetry in action and the level of inspection you could go through when dealing with outgoing web service calls.
Imagine the same scenario without telemetry. You wouldn’t have solved that so easily. Even if you would have implemented a custom (=costly) log collection inside Dynamics 365 Business Central.
As many times stressed in the session in Lyon: “if you do not uptake telemetry in your daily life, you are just navigating by the stars”.

Hi Duilio,Thank you very much this inspiring post. I’d like to see more use case when telemetry helped to identify bottlenecks.
LikeLike