
Open in Excel is a great feature. But what if I am telling you that could lead to a high-locking scenario? …
Yes, I know. I am insane. Thanks. But as Arya used to say: “not today”.

How did I get to this conclusion? You never have to ask. Telemetry, of course. And this is yet again a real-life scenario.
One day, I have got a ping stating that trying to Open in Excel the lines of a sales invoice (more than 1.000 lines – worth mentioning -) was in stuck and after few minutes there was still a spinning wheel and application in elaboration.

Together with this, as a cherry topping the cake, since the Open in Excel started, many users were slowing down or completely freeze in their operations.
Based on these assumptions, I started with the typical troubleshooting with telemetry.
- Overview
In this case, the general overview has been fully provided by the user stating exactly when it was happening and it was related to a specific date and time. All such details represent the general scenario overview that should lead you to dig deeper into the drill-down section.
- Drill-Down
When it was reported starting the slowliness, the user could not have been precise like a swiss clock, so that I am typically taking the immediate 5 or 10 minutes before the first customer report and use the typical long running thinghy signals, grouped by stack trace:
RT0005 : Long Running SQL Statement
RT0018 : Long Running AL Statement
traces
| where timestamp between (datetime(2023-09-11T06:45:31Z)..datetime(2023-09-11T06:51:31Z))
…
| where customDimensions.eventId in (“RT0005″,”RT0018”)
| extend eventId = tostring(customDimensions.eventId)
, extensionName = tostring(customDimensions.extensionName)
, objectName = tostring(customDimensions.alObjectName)
, objectType = tostring(customDimensions.alObjectType)
, stackTrace = tostring(customDimensions.alStackTrace)
| summarize count() by eventId, extensionName, objectType, objectName, stackTrace
| sort by count_ desc
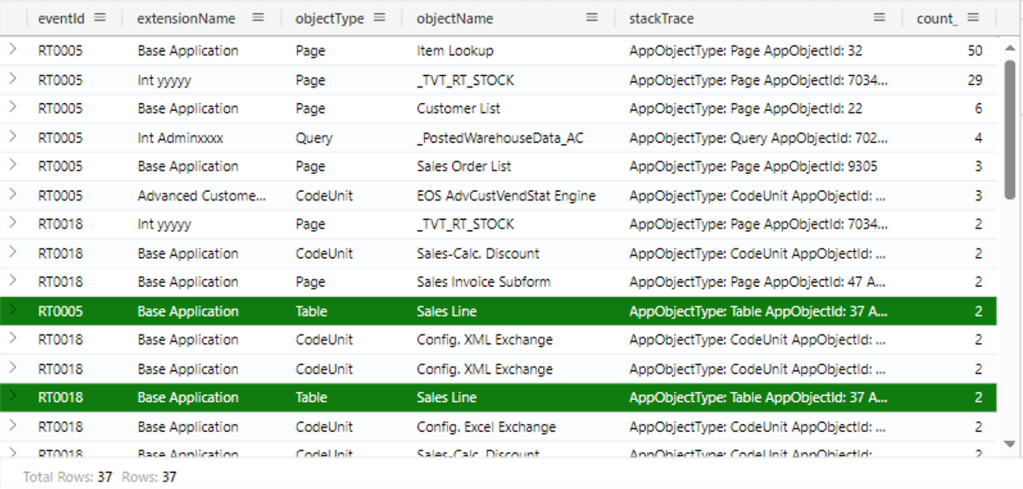
Focus on what was running in these 5/10 minutes. The first two elements, with 50 and 29 count, in that time range are not the interesting ones in this scenario BUT there have been 4 referencing Sales Line that could have been part of this scenario, together with the Config. XML / Excel Exchange, used to create XML nodes when exporting to Excel. The Config. XML / Excel Exchange elements were part of the process, yes, but not relevant to start such degraded performance scenario, so let’s forget about them.
Expanding the Stack Trace related to Long Running SQL Query (RT0005) for Sales Line, I have found out the following:
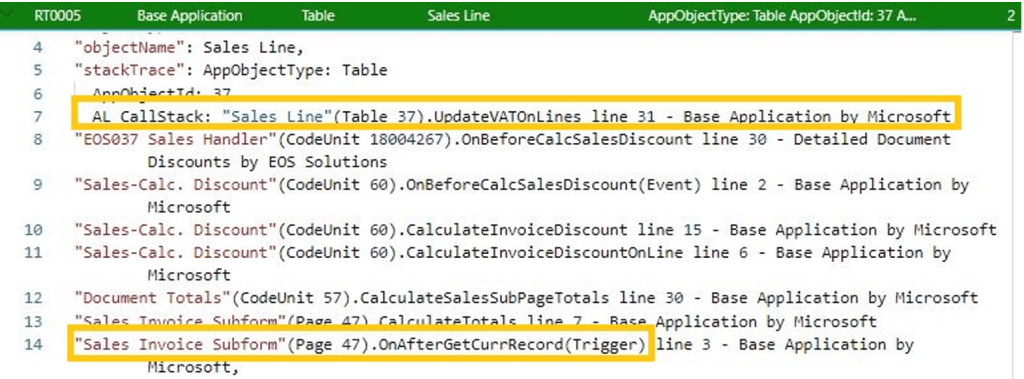
We have a champ here: UpdateVATOnLines procedure is quite invasive. Below an example of the SQL Query associated with the stack trace above:
“sqlStatement”:
“SELECT \”37\”.\”timestamp\”,\”37\”.\”Document Type\”,\”37\”.\”Document No_\”,\”37\”.\”Line No_\” …
FROM \”SQLDATABASE\”.dbo.\”CURRENTCOMPANY$Sales Line$437dbf0e-84ff-417a-965d-ed2bb9650972\” \”37\”
WITH(UPDLOCK)
WHERE (\”37\”.\”Document Type\”=@0 AND \”37\”.\”Document No_\”=@1)
ORDER BY \”Document Type\” ASC,\”Document No_\” ASC,\”Line No_\” ASC OPTION(OPTIMIZE FOR UNKNOWN, FAST 50)”
Let’s validate the assumption moving it into the isolation part.
- Isolate: use specific signal(s) or a specific keyword
UpdateVATOnLines is the suspicious method that could generate this high-locking scenario with the symptoms reported by the user.
By filtering all telemetry events that do have in their Stack Trace property the keyword UpdateVATOnLines we will have insights which signals are related to this method and in this context:
traces
| where timestamp between (datetime(2023-09-11T06:45:31Z)..datetime(2023-09-11T06:51:31Z))
…
| extend extensionName = tostring(customDimensions.extensionName)
, objectName = tostring(customDimensions.alObjectName) \
, eventId = tostring(customDimensions.eventId)
, objectType = tostring(customDimensions.alObjectType)
, stackTrace = tostring(customDimensions.alStackTrace)
| where stackTrace contains “UpdateVATOnLines”
| summarize count() by eventId, extensionName, objectType, objectName, stackTrace
| sort by count_ desc
And the result was:

- RT0013 : Database lock snapshot (snapshot Id) (18 entries)
- RT0012 : Database lock timed out (2 entries)
- RT0027 : Database lock snapshot taken (2 entries)
- RT0030 : Error Dialog displayed (2 entries)
This confirmed the scenario: Open In Excel operation were generating a high-locking scenario (with also lock timeouts) due to the execution of UpdateVATOnLines method for every single line. This method is called in the OnAfterGetCurrRecord trigger and fired more than 1.000 times repeatedly in this case. That method is typically used to recalculate VAT totals to be displayed in the subpage while entering data.
Are you kidding me?

OnAfterGetCurrRecord is supposed to be triggered when positioning in a list when all the lines have been populated in the recordset served to the client. There is more. Why the heck Open In Excel should call OnAfterGetCurrRecord trigger for all the lines? This is totally unnecessary and looks like a bug or a feature limitation (defect) to me.
Now I know, now you know.
If you still don’t trust me (ah, I know you do. Me neither.), just create the following super simple codeunit with a subscriber and deploy it.
codeunit 50118 UpdateVATMessage
{
[EventSubscriber(ObjectType::Page, Page::”Sales Invoice Subform”, OnBeforeCalculateTotals, ”, false, false)]
procedure OnBeforeCalculateTotals(var TotalSalesLine: Record “Sales Line”; var SuppressTotals: Boolean)
begin
Message(‘I am updating VAT On Lines…’);
end;
}
Take a sales invoice with more than one line. Let’s say 5 lines, as example.
When you open the sales invoice the message is triggered just 1 time. This is expected. It will be the last positioning on the current record.
Then try to Open In Excel the sales invoice lines from the subpage: you will receive 5 messages (or N messages, with N = number of sales invoice lines).
CONCLUSION AND TAKEAWAYS
In this SaaS real-life scenario (yes, again, it really happened) I could clearly demonstrate the value of having telemetry in action and the level of inspection you could go through when dealing with a locking scenario.
Imagine the same scenario without telemetry. How would you have solved? Probably taking a backup and attaching the debugger and trying to understand where this problem might come from. Locks are shown in Visual Studio Code and you might have been lucky enough in understand a bit of this scenario after some time (and without concurrency it would have been ever more difficult). But with telemetry – oh boy – everything is registered and under your nose exactly from where and when this happened.
Like in the previous blog and as many times stressed in the session in Lyon: “if you do not uptake telemetries in your daily life, you are just navigating by the stars”.
Almost forgiving. How did we get all these lines into Excel without blocking users? Easy peasy. Go to Sales Lines page and filter them with the appropriate Type and Document No., then do the Open In Excel. In this specific case: 1.000K rows were exported into Excel finger snap.
And this could/should be the solution, until Microsoft will, hopefully, improve the experience with Open In Excel and decide not to trigger OnAfterGetCurrRecord.

I think the problem is another: why is a function that is called from OnAfterGetCurrRecord doing updates to the DB? It should only read data.
LikeLike
Well, there are different angles where you could approach this. Even if you move out the standard code, there could be (and there are – we have other practical cases -) other apps subscribing to OnAfterGetCurrRecord in this scenario. And they could do a discrete number of reads. Repeating this N time will lead to a performance drop in read and this should not happen at all since Open In Excel have already everything at hands and should not call N times that trigger (imho).
LikeLike
Hi Duilio,
I came across the same issue on the ItemList page. Runs thorugh the OnAfterGetCurrentRecord for every single record. Takes minutes until the export is ready.
Did you receive an update on when this behavior will be corrected?
LikeLike
Unfortunately this has been classified as by design by Microsoft a long ago. There could be BC Ideas logged to change this behavior to vote for, if I am not wrong.
LikeLike
Thanks Duilio,
strange that they don’t take your advice/request seriously, you the man, the MVP who knows all about performance 🙂 Well maybe there were more urgent issues to resolve.
Have a nice weekend!
LikeLike