
Shout out to Marije Brummel – De Krosse for her great post about Index packages and to be an inspiration in all of these years (not only for me, I believe). This post is somehow connected to her blog post. Check that out first.
The hardest part to work with the online version is due to the lack of knowledge about the current architecture and settings that lies behind the scenes and capabilities to change them at will.
On-premises you have a wide variety of standard tools, and 3rd party tools built on top of them, that could help you spot out in a short time where an issue might lie. Depending on the issue, without changing business processes, you could intervene by:
- Change infrastructure.
- Change configuration settings.
- Refactor code.
This is the typical performance troubleshooting cycle stream (collect/analyze – change – test).
With Dynamics 365 Business Central SaaS, it is only possible to go for point 3. And it is currently limited to the code you own.
And there it is where the serenity prayer kicks in:
“Lord grant me the serenity to accept the things I cannot change; courage to change the things I can; And wisdom to know the difference.”
This blog post is a prayer to have more telemetry to boost my (and probably yours) “courage” to change the things that I can.
MISSING INDEX SUGGESTION
There is a “Database Missing Indexes” page within the UI.

That page will execute:
SELECT index_handle,
       object_name(object_id) AS object_name,
       ISNULL(dm_db_missing_index_details.equality_columns, '') AS equality_columns,
       ISNULL(dm_db_missing_index_details.inequality_columns, '') AS inequality_columns,
       ISNULL(dm_db_missing_index_details.included_columns, '') AS included_columns,
       statement
FROM sys.dm_db_missing_index_details
WHERE dm_db_missing_index_details.database_id = DB_ID(db_name())
That is super good BUT it is missing quite important details (imho, of course):
- Number of user seeks. (how many times)
- Last user seek (to spot out if it is outdated)
- Average total user seeks cost (it will give you an idea of the relative cost of the query)
- Average user impact % (how much the cost could be reduced, in percentage)
These values, will provide what is called an index advantage:
Index Advantage = number of user seeks * average total user seeks cost * impact %
In this way, it is possible have a rank of the indexes to be created. Below an example (from an on-premise installation, of course)
| Index_advantage | 20.758.084 |
| last_user_seek | 28/02/2024 14:50 |
| Database,Schema,Table | [PROD],[dbo],[CompanyXXX$Warehouse Entry] |
| equality_columns | [UdC No_] |
| inequality_columns | NULL |
| included_columns | [Location Code], [Bin Code], [Item No_], [Qty_ (Base)], [Variant Code], [Lot No_] |
| user_seeks | 328.726 |
| avg_total_user_cost | 63,43 |
| avg_user_impact | 99,55 |
I would be happy if this could be sent through telemetry e.g. once a week or month (configurable it will be even better) and on-demand by enabling verbose mode.
Below the query that I am using nowadays to spot missing indexes (on-premises) and calculate index advantage:
SELECT CONVERT(decimal(18,2), migs.user_seeks * migs.avg_total_user_cost * (migs.avg_user_impact * 0.01)) AS [index_advantage],
CONVERT(nvarchar(25), migs.last_user_seek, 20) AS [last_user_seek],
mid.[statement] AS [Database.Schema.Table],
mid.equality_columns, mid.inequality_columns, mid.included_columns, migs.user_seeks,
CONVERT(decimal(18,2), migs.avg_total_user_cost) AS [avg_total_user_,cost], migs.avg_user_impact
FROM sys.dm_db_missing_index_groups AS mig WITH (NOLOCK)
INNER JOIN sys.dm_db_missing_index_group_stats_query AS migs WITH(NOLOCK)
ON mig.index_group_handle = migs.group_handle
CROSS APPLY sys.dm_exec_sql_text(migs.last_sql_handle) AS st
INNER JOIN sys.dm_db_missing_index_details AS mid WITH (NOLOCK)
ON mig.index_handle = mid.index_handle
INNER JOIN sys.partitions AS p WITH (NOLOCK)
ON p.[object_id] = mid.[object_id]
WHERE mid.database_id = DB_ID()
AND p.index_id < 2
ORDER BY index_advantage DESC OPTION (RECOMPILE);
DISABLE INDEX
This promising feature popped-up in 2023 Wave 2 announcement (version 23.x) and after few days it was removed from the what’s new and planned. Puff… Disappeared.
Honestly? After the new table extension model, it would have been really another standing ovation feature.
But No. It is not the time, still.
Again “Lord grant me the serenity to accept… etc.”
So, now, what it is really needed, in my humble opinion, is the capability of disabling indexes, for a faster write experience (insert, update, delete), AND a related page and telemetry signal that would provide info on the number of reads and writes for that specific index.
See below an example:
| Table Name | Index Name | index_id | Total Writes | Total Reads | Difference |
| CompanyXXX$Item Calculation Line | $1 | 2 | 26660 | 70 | 2590 |
| CompanyXXX$Item Calculation Line | $4 | 3 | 16512 | 0 | 1512 |
| CompanyXXXProd_ Order Line | $12 | 11 | 13639 | 0 | 1339 |
| CompanyYYY$Prod_ Order Line | $12 | 11 | 3616 | 0 | 361 |
In this way, it is possible to wisely disable indexes that are never used (so-called “unused indexes”) and also the ones that have a very high disadvantage (difference) in I/O.
I am fully aware that there can be thousands of indexes within a database, I understand.
That is why, it would be great to have a page (like the missing index one) within the UI that show them all and a telemetry signal that sends out just the top X (e.g. 100) ordered by difference between writes and reads (desc).
FYI these are the 2 queries that I am mostly using for this purpose, on-premises. The first one is more generic and shows up the delta between total reads and writes:
SELECT SCHEMA_NAME(o.[schema_id]) AS [Schema Name],
OBJECT_NAME(s.[object_id]) AS [Table Name],
i.name AS [Index Name], i.index_id,
i.is_disabled, i.is_hypothetical, i.has_filter, i.fill_factor,
s.user_updates AS [Total Writes], s.user_seeks + s.user_scans + s.user_lookups AS [Total Reads],
s.user_updates - (s.user_seeks + s.user_scans + s.user_lookups) AS [Difference]
FROM sys.dm_db_index_usage_stats AS s WITH (NOLOCK)
INNER JOIN sys.indexes AS i WITH (NOLOCK)
ON s.[object_id] = i.[object_id]
AND i.index_id = s.index_id
INNER JOIN sys.objects AS o WITH (NOLOCK)
ON i.[object_id] = o.[object_id]
WHERE OBJECTPROPERTY(s.[object_id],'IsUserTable') = 1
AND s.database_id = DB_ID()
AND s.user_updates > (s.user_seeks + s.user_scans + s.user_lookups)
AND i.index_id > 1 AND i.[type_desc] = N'NONCLUSTERED'
AND i.is_primary_key = 0
ORDER BY [Difference] DESC, [Total Writes] DESC, [Total Reads] ASC OPTION (RECOMPILE);
LOCKS AND BLOCKS
There is a “Database Locks” page within the UI.

That page will execute:
WITH locks AS (
    SELECT DISTINCT
        dm_tran_locks.request_owner_id,
        dm_tran_locks.request_session_id,
        dm_tran_locks.resource_type,
        dm_tran_locks.request_mode,
        dm_tran_locks.request_status,
        dm_tran_locks.resource_associated_entity_id
    FROM sys.dm_tran_locks WITH (NOLOCK)
    WHERE
    resource_associated_entity_id > 0 AND
    request_mode not in ( 'Sch-S', 'Sch-M', 'IS', 'IU', 'IX')
)
SELECT
    objects.name AS object_name,
    locks.request_owner_id,
    locks.request_session_id,
    locks.resource_type,
    locks.request_mode,
    locks.request_status
FROM locks
LEFT JOIN sys.partitions WITH (NOLOCK) ON partitions.hobt_id = locks.resource_associated_entity_id
JOIN sys.objects WITH (NOLOCK) ON sys.objects.object_id =
    (CASE WHEN resource_type = 'OBJECT' THEN locks.resource_associated_entity_id ELSE partitions.object_id END)
I am hearing sometimes people mixing locking and blocking, like these are the same thing.
Ehm… sorry but No.
Let me put these concepts in my own words and consider me accountable for that:
Locking is one of the features that help guarantee the “I” of the ACID (Atomicity, Consistency, Isolation, Durability) for RDBMS (Relational Database Management System) and it is a complex mechanism that isolate a specific resource within a transaction. You can see locking as sort of traffic light for transactions (one or more queries). Green, ok you can cross the road (read/write). Orange, it depends. Red, stop until transaction is finished.
Blocking is a consequence of this mechanism, considering concurrency. If my transaction holds a lock on that resource, it has green light to proceed, while other transactions that have red light they need to (more or less) patiently wait, in other words they are blocked, until the lock on that resource is released.
Putting both statements together we could hazard the following mantra:
- No locks, No blocks
- No concurrency, No blocks
- Quick Locks, Quick blocks
It is not exactly this way, but if you tattoo this in mind, you are in a good development mindset. With this statement, I mean
- Carefully controlling the isolation type of the queries (no locks, no blocks)
- Thinking of serializing and/or decoupling reading and writing processes, where possible (no concurrency = no blocks)
- Duration of write (insert/update/delete) transactions (reduced locking time = reduced blocking time)
If you are working with NAV/BC and SQL Server (or simply working with SQL Server) on-premises, then you probably know that there are more blocking detection scripts than stars in the sky. Basically, such scripts are sniffing when there are long running queries with locks and reporting who is holding the long lock and who is the victim of a lock timeout (plus a wide variety of SQL-related information).
Considering Dynamics 365 Business Central online, there is a telemetry signal for lock timeouts (RT0012)

and its related lock snapshot (RT0013)
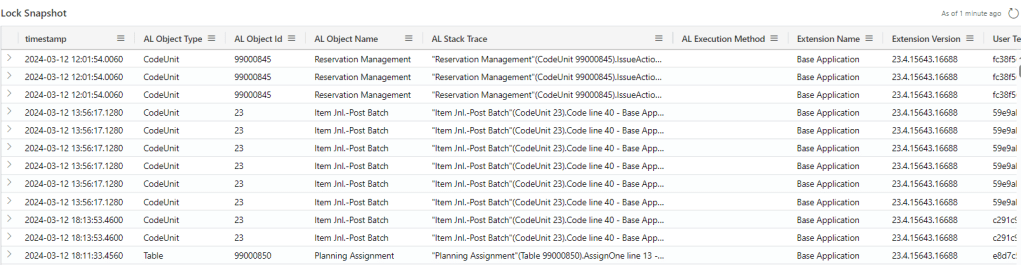
that could help you identifying who is the blockers by combining both. See https://learn.microsoft.com/en-us/dynamics365/business-central/dev-itpro/administration/telemetry-database-locks-trace
This does not work perfectly in all cases for several reasons and information available might not completely be helpful in identifying the root cause of the block.
In shorts, the Starsky & Hutch of lock timeouts, RT0012 and RT0013, might not always trap the offending long-locking transaction.

To know more what I am talking about, just read https://navfreak.com/2024/02/28/how-to-find-which-user-is-locking-a-table-in-business-central/
Yes, RT0012 will tell you there is a lock timeout, the victim, and its stack trace. Fine. But it will not provide explicitely in the signal custom dimensions, who was the blocker user telemetry id, the blocking stack trace and the sql statement.
The main advantage of having such today-missing information (blocking user telemetry id, stack trace and sql statement) is not only to find out a solid pattern to work on, from a code perspective, but also it would be incredibly helpful in resolve long blocking situation in a relative short time, probably in almost real-time.
It happened to me to be called by IT department because several users could not perform their activity and they were kicked out, almost simultaneously, with the typical lock timeout error. As per official documentation, if “I am lucky”, I could spot out the blocking session directly from telemetry even without logging into customer database (typically to run “Database locks””). In few “unlucky” cases, I had to spend a bit of time correlating signals to find out the blocking session (obviously terminated in the good-old way aka session killed from Tenant Admin Center).
All in all, if you think it would be a good catch to have a better locking visibility in the online version, I would suggest you to vote this IDEA: https://experience.dynamics.com/ideas/idea/?ideaid=7b1b35b2-c9a4-ea11-8b71-0003ff68b7e1 )
DEADLOCK
Let’s resume the deadlock in few lines and in the easiest, and fun, way as possible.
Cap and IronMan are fighting, Thor is the match supervisor. To win the fight, Cap must rip the mask of IronMan and IronMan must rip Cap’s shield.

Imagine it will happen the following:
- Cap locks his Shield
- IronMan locks his Mask
- Cap tries ripping IronMan’s mask
- IronMan tries ripping Cap’s shield.
None could win. But the avengers cannot be stuck in an endless fight, so that Thor decide who wins.
To be a bit more professional,
- Session A locks Resource X
- Session B locks Resource Y
- Session A tries to lock Resource Y
- Session B tries to lock Resource X
That is a deadlock and SQL Server detects it finger snap and decide by its own the deadlock’s victim that must rollback.
The basic info that define a deadlock (in telemetry) should be 6:
- Session id that wins the fight
- AL stack trace (winner)
- Resource X locked by the winner
- Session id rolled back (victim)
- AL stack trace (victim)
- Resource Y locked by the victim (released as per deadlock resolution)
Now, let’s consider deadlock telemetry signal RT0028 (see https://learn.microsoft.com/en-us/dynamics365/business-central/dev-itpro/administration/telemetry-database-deadlocks-trace) where you could build up specific dashboards like the ones below
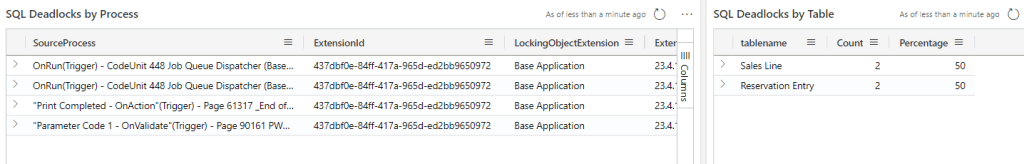
This is, again, limping. You only have a piece of that:
- Session id that rolled back (victim)
- AL Stack Trace for the victim
- Resource Y (released as per deadlock resolution)
Still there are important missing parts:
- Session id that wins the fight
- AL stack trace for the winner
- Resource X (that the victim was trying to access)
I am not asking for the fancy deadlock graph image but simply to complete the missing part of the signal.
Related to deadlocks, another thing that I am still missing from the good-old days is the locking order within each transaction. I know, I am getting old, but this was possible 15+ years ago, in the Jurassic, with the Client Monitor.
See, for example: https://cloudblogs.microsoft.com/dynamics365/no-audience/2008/02/20/how-to-detect-locking-order-for-a-nav-process/
It would be super great if Microsoft could re-create the same transaction output and for each transaction, determine what was the locking order to spot out easily where the deadlock was coming from.
As of now, where possible, I am trying to run in debug mode the same procedure involved in the deadlock, and take note of the locked resources and their order. Sometimes, with complex integration and high concurrency in production environment, this process is a bit difficult to reproduce exactly, hence I have to fall back looking at the code and note down the locking order “on the chart”.
Telling you the truth, with the enormous usage of APIs, Job Queue running, etc. it is quite a challenge within SaaS to resolve deadlocks in a timely manner, without having the full picture at hands.
You get to the bottom of the line, yes, but it is more challenging and time-consuming process than On-Premises. At least this is my experience.
And if you have telemetry enabled, of course.
Because if you don’t – trust me – you probably will never get this resolved.

Leave a comment