Let me tell you the truth… My truth, probably. One truth, then.
Writing about Wait Stats is always like touching a wasp nest. Every time.
It is more WRITING about analyzing Wait Stats that is like swimming in the Ocean of possibilities.
There are even entire books that have been written, expressively dedicated to performing this specific troubleshooting task. One reference below:
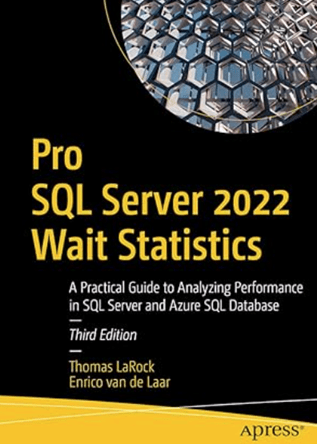
These are 400+ pages, targeting the most common way to analyze Wait Stats to pinpoint root cause for performance related issues.
But if you are lazy and if you want a condensed (and free) version, then download this milestone PDF:
sql-server-performance-tuning-using-wait-statistics-whitepaper.pdf
and check the following blog post: SQL Server Wait Statistics: Tell me where it hurts
Now read all of them (or, at least, the PDF file) and come back here right after.
Ciao, see you later! Goodbye.
.
..
…
….
…Ah, you finally came back! Long time no see…

Now that you know – or think to know – what Wait Stats are, why they are important and which information they provide, we could focus on Dynamics 365 Business Central.
First. On-Premises. In there, you have control over your SQL Server or Azure SQL Database, hence you would go directly in running specific T-SQL queries and analyze the outputs. Queries that are duly described in the book – that you just read, right? – or the ones that you might find out anywhere on the internet.
Considering Dynamics 365 Business Central Online, what do we have?
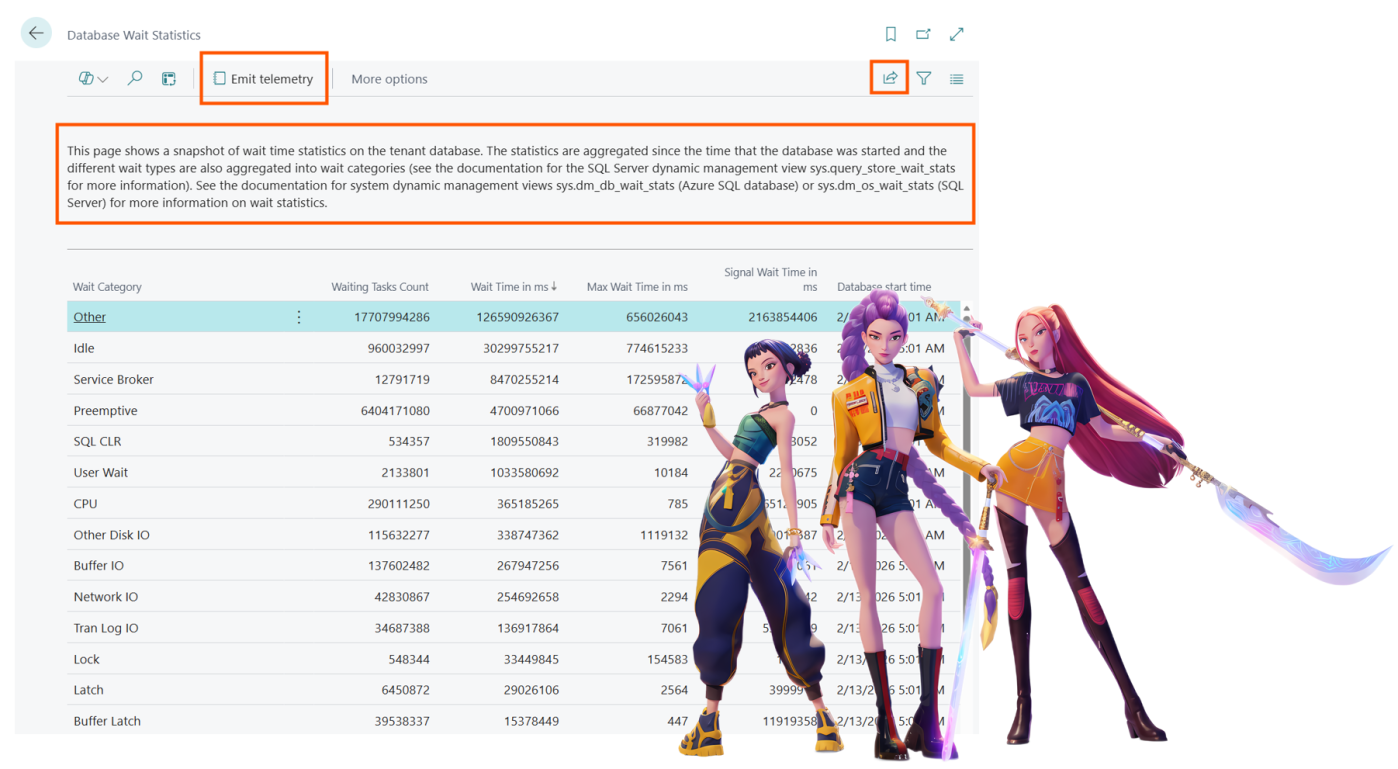
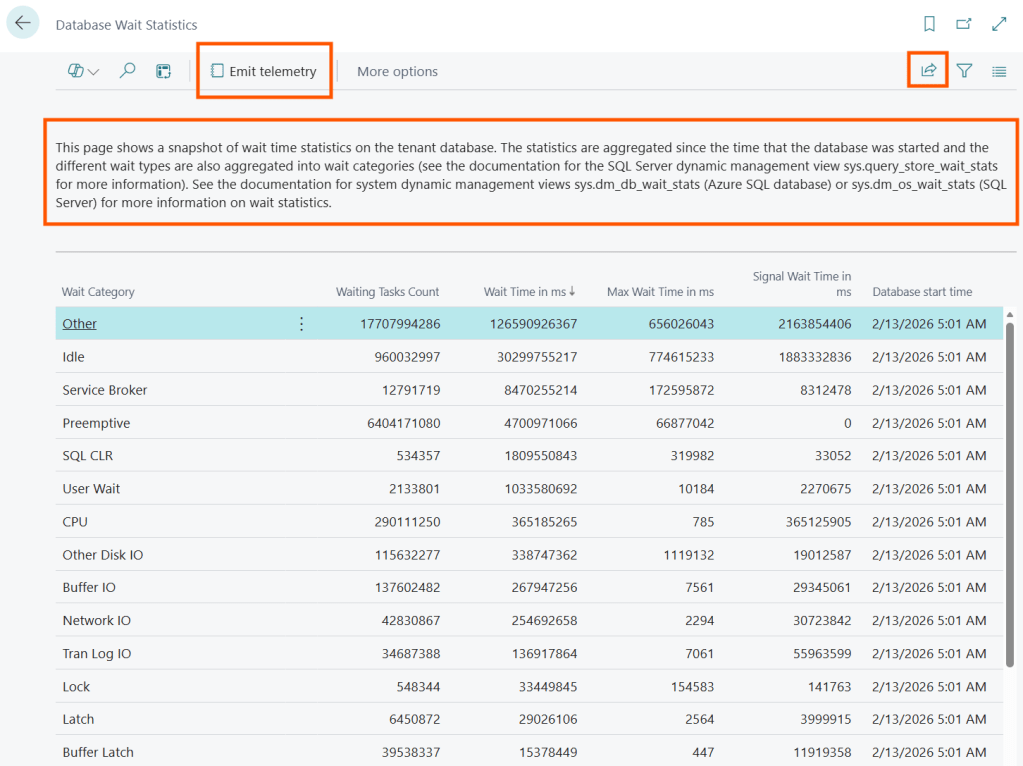
There is a specific page called “Database Wait Statistics” where there will be reported grouped set of Wait counters and the last database start time (or, in other words, since when the statistics are collected). You can export them in Excel and/or emit them in Telemetry.
How are these statistics collected?
Easy. This is the query that runs behind the scenes (That is from SQL On-prem. Online it is the same but use a different DMV name):
SELECT res.wait_category_desc , SUM(res.waiting_tasks_count) AS total_waiting_tasks_count , SUM(res.wait_time_ms) AS sum_wait_time_ms , MAX(res.max_wait_time_ms) AS max_wait_time_ms , SUM(res.signal_wait_time_ms) AS sum_signal_wait_time_ms , res.age_in_ticksFROM ( SELECT CASE WHEN wait_stats.wait_type = N'SOS_SCHEDULER_YIELD' then N'CPU' WHEN wait_stats.wait_type = N'THREADPOOL' then N'Worker Thread' WHEN wait_stats.wait_type like N'LCK_M_%' then N'Lock' WHEN wait_stats.wait_type like N'LATCH_%' then N'Latch' WHEN wait_stats.wait_type like N'PAGELATCH_%' then N'Buffer Latch' WHEN wait_stats.wait_type like N'PAGEIOLATCH_%' then N'Buffer IO' WHEN wait_stats.wait_type like N'RESOURCE_SEMAPHORE_%' then N'Compilation' WHEN wait_stats.wait_type like N'CLR_%' or wait_stats.wait_type like N'SQLCLR%' then N'SQL CLR' WHEN wait_stats.wait_type like N'DBMIRROR%' or wait_stats.wait_type = N'MIRROR_SEND_MESSAGE' then N'Mirroring' WHEN wait_stats.wait_type like N'XACT%' or wait_stats.wait_type like N'DTC_%' or wait_stats.wait_type like N'TRAN_MARKLATCH_%' or wait_stats.wait_type like N'MSQL_XACT_%' or wait_stats.wait_type = N'TRANSACTION_MUTEX' then N'Transaction' WHEN wait_stats.wait_type like N'SLEEP_%' or wait_stats.wait_type in(N'LAZYWRITER_SLEEP', N'SQLTRACE_BUFFER_FLUSH', N'SQLTRACE_INCREMENTAL_FLUSH_SLEEP', N'SQLTRACE_WAIT_ENTRIES', N'FT_IFTS_SCHEDULER_IDLE_WAIT', N'XE_DISPATCHER_WAIT', N'REQUEST_FOR_DEADLOCK_SEARCH', N'SLEEP_TASK', N'LOGMGR_QUEUE', N'ONDEMAND_TASK_QUEUE', N'CHECKPOINT_QUEUE', N'XE_TIMER_EVENT') then N'Idle' WHEN wait_stats.wait_type like N'PREEMPTIVE_%' then N'Preemptive' WHEN wait_stats.wait_type like N'BROKER_%' then N'Service Broker' WHEN wait_stats.wait_type in (N'LOGMGR', N'LOGBUFFER', N'LOGMGR_RESERVE_APPEND', N'LOGMGR_FLUSH', N'WRITELOG') then N'Tran Log IO' WHEN wait_stats.wait_type in (N'ASYNC_NETWORK_IO', N'NET_WAITFOR_PACKET') then N'Network IO' WHEN wait_stats.wait_type in (N'CXPACKET', N'EXCHANGE') then N'Parallelism' WHEN wait_stats.wait_type in (N'RESOURCE_SEMAPHORE', N'CMEMTHREAD', N'SOS_RESERVEDMEMBLOCKLIST') then N'Memory' WHEN wait_stats.wait_type in (N'WAITFOR', N'WAIT_FOR_RESULTS', N'BROKER_RECEIVE_WAITFOR') then N'User Wait' WHEN wait_stats.wait_type in (N'TRACEWRITE', N'SQLTRACE_LOCK', N'SQLTRACE_FILE_BUFFER', N'SQLTRACE_FILE_WRITE_IO_COMPLETION') then N'Tracing' WHEN wait_stats.wait_type in (N'FT_RESTART_CRAWL', N'FULLTEXT GATHERER', N'MSSEARCH') then N'Full Text Search' WHEN wait_stats.wait_type in (N'ASYNC_IO_COMPLETION', N'IO_COMPLETION', N'BACKUPIO', N'WRITE_COMPLETION') then N'Other Disk IO' ELSE N'Other' END AS wait_category_desc , wait_stats.waiting_tasks_count , wait_stats.wait_time_ms , wait_stats.max_wait_time_ms , wait_stats.signal_wait_time_ms , os_info.ms_ticks - os_info.sqlserver_start_time_ms_ticks AS age_in_ticks FROM sys.dm_os_wait_stats AS wait_stats CROSS JOIN sys.dm_os_sys_info AS os_info WHERE wait_stats.max_wait_time_ms > 0) AS resGROUP BY res.wait_category_desc, res.age_in_ticks
Let me shrink this a bit into what these values are and potentially the info they gather. As I said, I do not want to go – for now – into every single wait category otherwise “facciamo notte” (we can stay here up to late night).
- wait_category_desc (Wait Category)
Group of wait type based on the information they gather. E.g. Full Text Search category regroups FT_RESTART_CRAWL, FULLTEXT GATHERER and MSSEARCH wait types. These grouping has been established by Dynamics 365 Business Central Product Group (Server Runtime team).
- waiting_tasks_count (Waiting Tasks Count)
The number of occurance a wait has been reported for each group category, since the last restart time.
- Wait_time_ms (Wait Time in Ms)
It is the total time the task had to wait for that specific category before running. This includes the specific resource wait time and the time waiting for CPU assignment.
- Signal_wait_time_ms (Signal Wait Time in Ms)
Sometimes called CPU wait. This is part of the total wait time and represents the time waiting for a processor to be assigned. It is worth checking how much time is spent on signal wait time, compared to the total wait time, in order to understand the balance between CPU resources and workload.
- Max_wait_time_ms (Max Wait Time in Ms)
In the pool of all waiting tasks, it is the highest wait time detected for that specific wait category. It might be useful to determine when there have been spikes in wait time for a specific category.
- Age_in_ticks
The time in ticks (weird name, I know) since when signals have been collected. It can be used to determine the last SQL restart. This is a very valid measure, overall if you are analyzing Database Missing Indexes (and I do not know why this value has not been added to that page as well…)
How do I use or interpret them?
EH… You must read the 400+ book twice! (and many others)

Let me give you something to bite, instead.
I was testing a scenario related to the old inventory posting methodology. The one that starts by finding the last Item Ledger Entry No., increment by one and keep it locked to avoid gaps in the table.
What I did is to setup Business Central Performance Toolkit (BCPT) – that me myself and I would have called Load Test Toolkit (BCLTT) instead – with
- 10 Concurrent Sessions
- 100 ms to 1000 ms random delay between each scenario
- 1 second between each run for each session
- Load test running for 10 Minutes
The load test will create Item Journals with a discrete bunch of items and post them. Nothing more and nothing less.
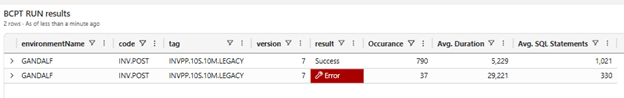
This activity, with the old inventory posting, is quite prone to deadlock and lock timeouts. And that was the outcome so far: 24 Lock Timeout and 3 Deadlock in 10 minutes.

With a Total of 37 Occurrence failed (27 due to locking issues) and 790 successes with approx. 5 seconds of execution time for each posting iteration, excluding the errors.
Not bad for a posting routine that has served thousands of customers for decades, hm??? And this is, today, just a blast from the past.
Ok. Fair enough. You got my point.
This is just an exercise to put a bit of pressure on this online Sandbox.
During the 10 minutes BCPT run, every 30 seconds I did:
- Open the Database Wait Statistics page
- Manually hit the button “Emit Telemetry”
- Close the Database Wait Statistics page
(if you like, you can create a small app that creates a job queue entry that runs N times or in a time window range with 30 seconds polling and it sends wait stats telemetry at each run).
So far so good.
Here are the results that you can pick up from telemetry:
Last Restart. Based on the tick, I have calculated the last restart
…| where customDimensions.eventId == "RT0026"| project timestamp , lastRestart = format_datetime(datetime_add('millisecond', - toint(customDimensions.databaseStartedDuration), timestamp),'yyyy-MM-dd')| distinct lastRestart…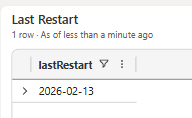
This is just informational. Now, I just know that DMVs collecting data have been restarted since 13th February.
Waiting tasks and Wait times per category
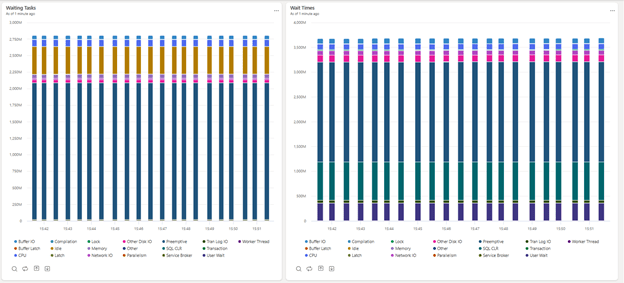
These are the results of pressing the button “Emit Telemetry” every 30 seconds. Per se, it does not give any kind of information since these are cumulative. If I want to monitor this activity, I should pick up the delta between the current and the previous.
Can this be done in KQL? Of course!
Waiting Tasks Deltas and their sum.
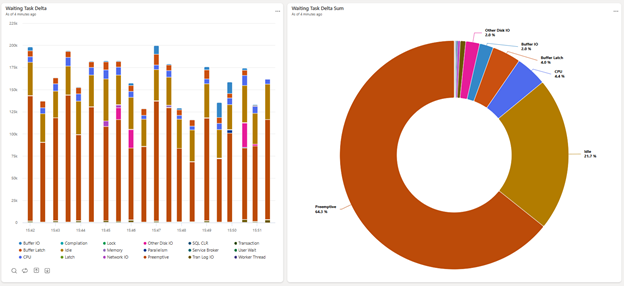
It represents the evolution of wait stats during the 10 minutes test.
To me it is again informative. Just stating that 64% of the tasks lie in the Preemptive category type. That’s all.
In this case (and most of the time), it is not the number of tasks but the wait time that is super important.
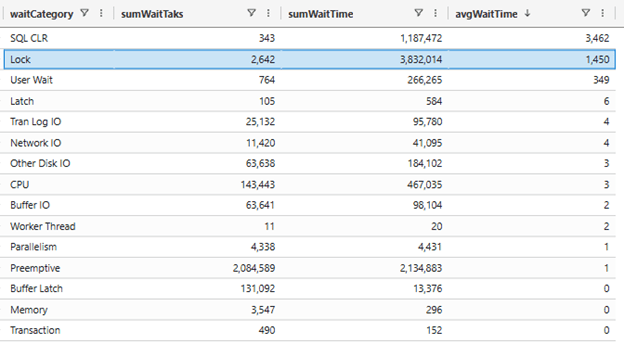
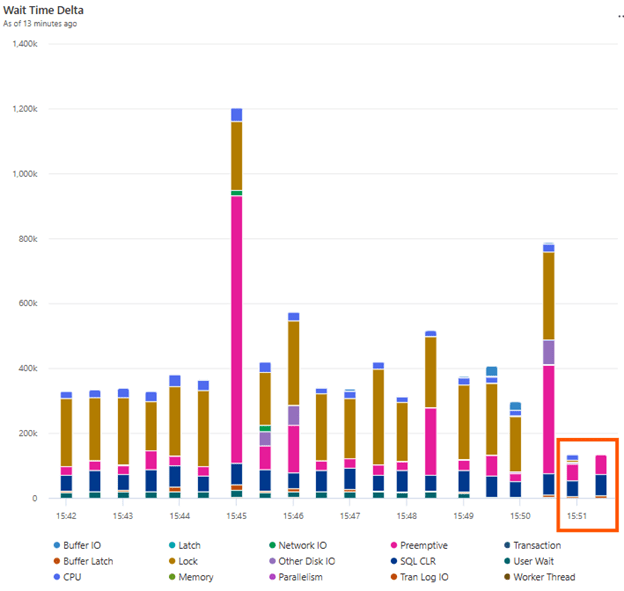
Wait Time Deltas and their sum.
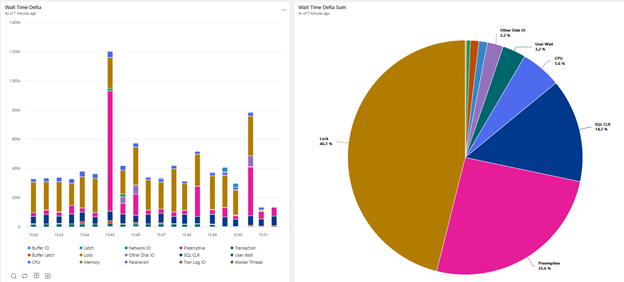
And this is exactly and vividly what was happening during the inventory posting test.
Despite not being even in the Top 10 waiting tasks count, the Lock wait time is quite serious in this scenario and covers 46% of the time tasks were waiting.
And if, instead of sum of wait times, we are considering the average, it is crystal clear who’s dominating the wait times in this context
Fun thing. You might also spot that all the heavy posting procedures were already over at 15:50:30, hence the last 2 captures clearly did not show any interesting lock waits.
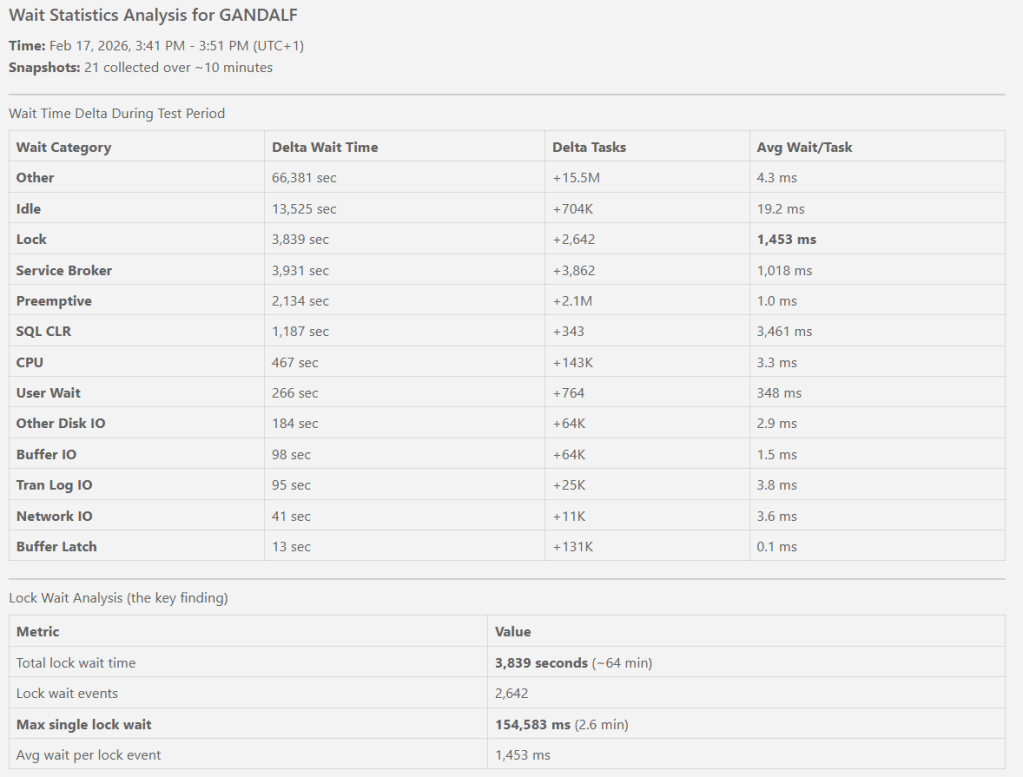
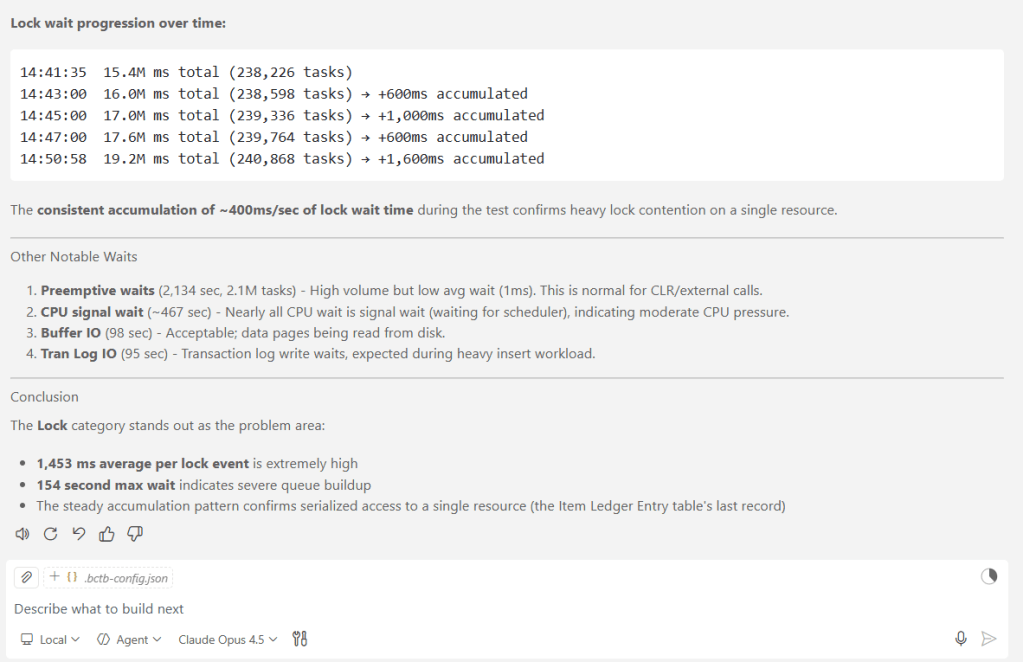
AI Assisted Analysis
If you give a good prompt to AI – that surely have read that book and many others – you have at hands another perspective on the overall picture.
What I did, then, is just to export in Excel all telemetry rows and explain that I was running BCPT to measure the old inventory posting. No more than that.
NOTE: I am using GitHub Copilot in Agent mode with Claude Opus 4.6.
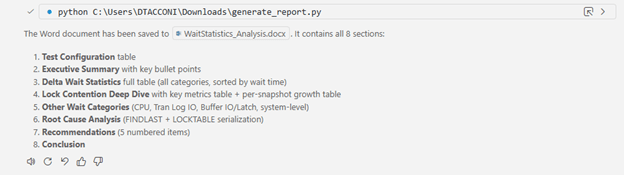
And the result is somewhat good… I must admit that. Too much pretending but we get to the same findings. You can download the document yourself…
It is trivial to say that instead of exporting values and feeding AI, a very similar result could have been probably achieved by querying telemetry through specific MCP tools, like the almighty BC Telemetry Buddy from Waldo.

(Thanks a ton again, my friend, for this little jewel)
CONCLUSION
Analyze wait statistics in Dynamics 365 Business Central Online have always been underestimated. It is complex, it is an aggregation of values, it might not give an actionable result…
But with AI. It is another story. Game changer. Totally.
You can simply export what you have as output in telemetry, then feed AI in the flavor that you prefer and you will get a quite precise report in a blink of an eye.
If I could add a bit more to this, I would love to ask MS to
- have ONE single signal sent over instead of N signals sent per single wait category. Like e.g. extensionInfo in Long Running AL Method, to give an example, I would have packed up all the signals into one single JSON notation and sent over just one single signal. That would have been more efficient since KQL is super good in unpacking signals.
- have ALL wait signals instead of an aggregation or, at least, a way to run the grouped query or the query with all signals (e.g. for spot analysis) to have a more detailed picture of what’s going on.
This is an example to get ALL wait signals:
SELECT res.wait_type , SUM(res.waiting_tasks_count) AS total_waiting_tasks_count , SUM(res.wait_time_ms) AS sum_wait_time_ms , MAX(res.max_wait_time_ms) AS max_wait_time_ms , SUM(res.signal_wait_time_ms) AS sum_signal_wait_time_ms , res.age_in_ticksFROM ( SELECT wait_stats.wait_type , wait_stats.waiting_tasks_count , wait_stats.wait_time_ms , wait_stats.max_wait_time_ms , wait_stats.signal_wait_time_ms , os_info.ms_ticks - os_info.sqlserver_start_time_ms_ticks AS age_in_ticks FROM sys.dm_os_wait_stats AS wait_stats CROSS JOIN sys.dm_os_sys_info AS os_info WHERE wait_stats.max_wait_time_ms > 0) AS resGROUP BY res.wait_type, res.age_in_ticksORDER BY sum_wait_time_ms DESCBut for now. This is GOLDEN.


Leave a comment