This enhancement introduced with Dynamics 365 Business Central 2025 Wave 2 (version 27) is placing the in-client profiler somewhat close to the good-old Event Tracing for Windows (ETW) in Dynamics NAV (https://github.com/wortho/EtwPerformanceProfiler), where you can profile C/AL code with SQL Statements, and also similar to its predecessor: the Client Monitor in CSIDE.
Well, you had the exact match between SQL Statement and C/AL Statement at that time, instead of a pool of queries within a method… but this is another story and other times.
If you want to have a flavor of this brand-new addition, I have some other official and unofficial references and video below:
View SQL call information in performance profiles | Microsoft Learn
What’s new: Capturing SQL calls in performance profiles – YouTube
Now, eyes on me

and let’s demonstrate easily this enhancement through the demo app (you can download it here : https://github.com/duiliotacconi/DT.AL/tree/main/BC27-Performance-Features ) using the “SQL Calls Profiler Demo” action.
What the action does is the following:
- Start profiling with AL Code behind the scenes
- Run some code that implies access to database
- Stop profiling AL Code and download the result
You can inspect the result opening the .alcpuprofile file in new or existing AL project in Visual Studio Code or
- Run the Web Client
- Search for “Performance Profiler”
- Click “Upload” action and import the generated .alcpuprofile file
- Toggle “Show Technical Information”
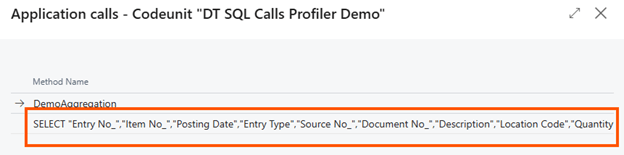
- Go to the “Time Spent by Application Object” section and click on the highlighted row under “Time Spent”

- In the Method Name you will see that there are the SQL Statement collected and not just the Method itself, as in previous versions
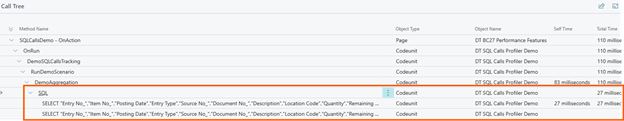
You can also see the SQL Statement in a tree view by expanding the Call Tree section
CONSIDERATIONS
SQL Statement collection in AL profiles is enabled only when tracing in sampling mode and not in instrumentation mode. Doing the math, you can, then, get SQL Statement in AL profiles when:
- Using the in-client performance profiler, as shown above
- Using in-client scheduled profiles
- Performing Snapshot Debugging via Visual Studio Code by specifying a profiling option type and sampling profiling type.

I would have personally added the same feature in instrumentation mode since I am using this feature a lot. In instrumentation mode, the profiler trace captured is consistent and specular to the code execution. For example, in sampling mode, you do not have a precise calculation of the method duration nor a real value for the hit count, but just an approximate inference.
Secondarily, in-client performance profiler application code has not been changed to accommodate for the SQL Server Statement with a more user-friendly UX. E.g. I would have liked to see calculated columns for: No. of Fields, No. of Joins, No. of Flow Fields (OUTER APPLY), Isolation Level. In shorts: a bit more of maquillage and make easier to search for e.g. long running queries with UPDLOCK or FindSet without SetLoadFieds, etc.
Nevertheless, even in this way, it is a super mega addition from Modern Development team and Server Runtime team (Bravo to both = Bravi). A real nice touch that will be helpful in pinpointing database access related performance issues in shorter time.

Helllo Duilio,
Great post and a nice addition to the tools set.
Cheers, Marco Mels
LikeLike
Hello Duilio,
Great post and this seems to be a nice addition to the tools set.
Cheers, Marco
LikeLike