
Recently, I have been reported that after an upgrade there have been random client crashes.
Let’s the hunt begin… But first:
How do you handle client crashes?
Ah. You are looking into Event Viewer in the Application Log in the machine that is hosting your NST.
… (silence)…
Well, in the online version you do NOT have access to Event Viewer. Sorry.
Let’s start from the beginning, then, how do you handle client crashes in the online version of Dynamics 365 Business Central?
(silence)
I tell you. Hold my beer…

When a crash happens, like the one shown below, the client reports a generic and useless “An error has occured”.
Oh. Don’t tell me… I was thinking you were taking a pause from life.

On-Premises, you might have access to Event Viewer and Application Log to spot out what was the last platform call stack before the client session rests in peace.
Unfortunately, the online version is a Fort Knox and there is no access to this treasure.
But what do we have, then? (say it loud!) TELEMETRY!

When the client dies with a smile, it always leaves you with a timestamp AND an operation id. To know what was happening, then, you must filter for operation_id column (in the crash above: 547d117b-6c6f-471b-89b4-e0f9cb704923)
traces | union pageViews
| where operation_Id == "547d117b-6c6f-471b-89b4-e0f9cb704923"
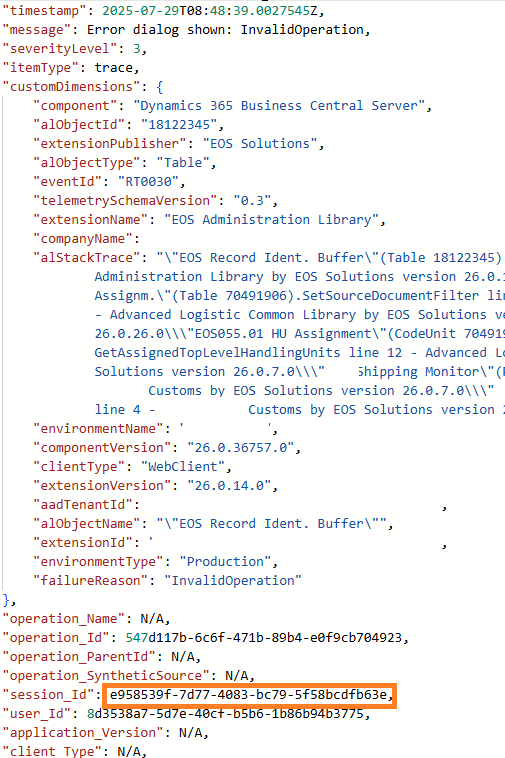

And when you have found something out, pick up the session_id and explore what the user (or whatever other client artifact) has performed since it was logged in. I am typically making a union of both traces and pageViews tables to keep the whole track of it.
traces | union pageViews
| where session_Id == "e958539f-7d77-4083-bc79-5f58bcdfb63e"
| project timestamp
    , eventId = tostring(customDimensions.eventId)
    , message
    , page = name
    , stackTrace = tostring(customDimensions.alStackTrace)
    , sqlStatement = tostring(customDimensions.sqlStatement)
| sort by timestamp desc

Yeah!!! I am hunting like a dog. Sniffing my prey…
And this time my best (signal) friend is the Error Dialog (RT0030).
See more on: Error method trace telemetry – Business Central | Microsoft Learn
What I did, then, was create a new tab with the relevant tiles related to Error Dialogs in the Azure Data Explorer Web UI Dashboard.
Error Dialogs Summary, summarized by failure reason (both in Table and Pie Chart fashion styles)
traces
| where timestamp between (_startTime .. _endTime)
| where customDimensions.eventId == "RT0030"
| where customDimensions.companyName has_any (_companyName)
| where customDimensions.extensionPublisher has_any (_publisher)
| where customDimensions.environmentType has_any (_environmentType)
| where customDimensions.environmentName has_any (_environmentName)
| where customDimensions.clientType has_any (_clientType)
| where customDimensions.failureReason has_any (_failureReason)
| project failureReason = tostring(customDimensions.failureReason)
| summarize Occurrance = count() by failureReason
| sort by Occurrance desc


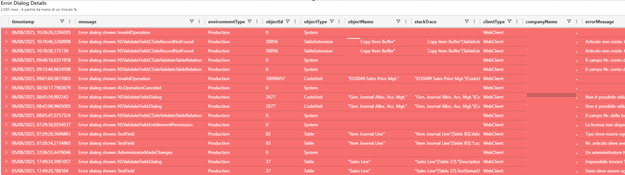
Error Dialog Details, with all relevant parts that I need, and the signal is offering.
traces
| where timestamp between (_startTime .. _endTime)
| where customDimensions.eventId == "RT0030"
| where customDimensions.companyName has_any (_companyName)
| where customDimensions.extensionPublisher has_any (_publisher)
| where customDimensions.environmentType has_any (_environmentType)
| where customDimensions.environmentName has_any (_environmentName)
| where customDimensions.clientType has_any (_clientType)
| where customDimensions.failureReason has_any (_failureReason)
| project timestamp
    , message = tostring(message)
    , environmentType = tostring(customDimensions.environmentType)
    , objectId = tostring(customDimensions.alObjectId)
    , objectType = tostring(customDimensions.alObjectType)
    , objectName = tostring(customDimensions.alObjectName)
    , stackTrace = tostring(customDimensions.alStackTrace)
    , clientType = tostring(customDimensions.clientType)
    , companyName = tostring(customDimensions.companyName)
    , errorMessage = tostring(customDimensions.alErrorMessage)
    , detailedErrorMessage = tostring(customDimensions.alDetailedErrorMessage)
    , failureReason = tostring(customDimensions.failureReason)
    , componentVersion = tostring(customDimensions.componentVersion)
    , extensionPublisher = tostring(customDimensions.extensionPublisher)
    , extensionId = tostring(customDimensions.extensionId)
    , extensionVersion = tostring(customDimensions.extensionVersion)
    , extensionName = tostring(customDimensions.extensionName)
    , operation_Id
    , session_Id
    , user_Id
| sort by timestamp desc
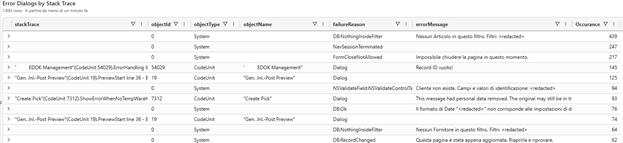
Error Dialog by Stack Trace
traces
| where timestamp between (_startTime .. _endTime)
| where customDimensions.eventId == "RT0030"
| where customDimensions.companyName has_any (_companyName)
| where customDimensions.extensionPublisher has_any (_publisher)
| where customDimensions.environmentType has_any (_environmentType)
| where customDimensions.environmentName has_any (_environmentName)
| where customDimensions.clientType has_any (_clientType)
| where customDimensions.failureReason has_any (_failureReason)
| project objectId = tostring(customDimensions.alObjectId)
    , objectType = tostring(customDimensions.alObjectType)
    , objectName = tostring(customDimensions.alObjectName)
    , stackTrace = tostring(customDimensions.alStackTrace)
    , errorMessage = tostring(customDimensions.alErrorMessage)
    , failureReason = tostring(customDimensions.failureReason)
| summarize Occurance = count() by stackTrace, objectId, objectType, objectName, failureReason, errorMessage
| sort by Occurance desc
Error Dialog Timeline by failure reason time chart, to monitor the evolution in time of different failures.
traces
| where timestamp between (_startTime .. _endTime)
| where customDimensions.eventId == "RT0030"
| where customDimensions.companyName has_any (_companyName)
| where customDimensions.extensionPublisher has_any (_publisher)
| where customDimensions.environmentType has_any (_environmentType)
| where customDimensions.environmentName has_any (_environmentName)
| where customDimensions.clientType has_any (_clientType)
| where customDimensions.failureReason has_any (_failureReason)
| project timestamp
    , failureReason = tostring(customDimensions.failureReason)
| sort by timestamp desc
| summarize count() by bin(timestamp,1d), failureReason
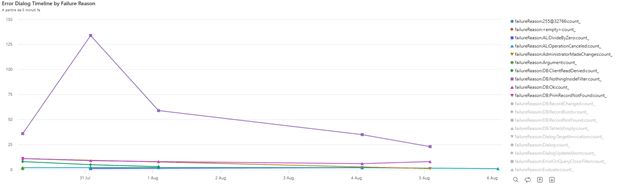
Let’s now filter this last chart on the specific failure reason reported by customer: InvalidOperation .
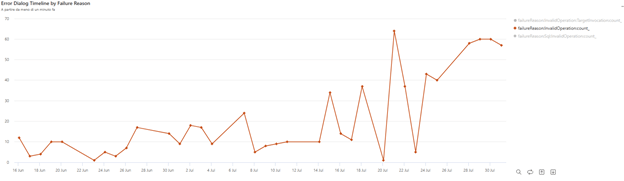
This chart is representative of 90-day retention policy and the first InvalidOperation exception was logged exactly the Monday after the update mid-June, and it shows an ascending trend.
It is clear to me, then, that this was an InvalidOperation exception whose behavior was introduced since the upgrade to 26.1 from 25.5, and the error dialog is swallowed by the crash itself. So, now, thanks to telemetry, we could move from a dumb “An error has occurred” to a shiny “A client crashes due to an Invalid Operation, as shown in the Error Dialog signals, and it has been introduced since we upgrade to 26.1”.
What was the Invalid Operation, from an application perspective, that caused the client crash? By filtering InvalidOperation error message and summarizing by stack trace, I could determine that it is spread all over different Microsoft and 3rd party code (322 single stack traces, in this specific case).
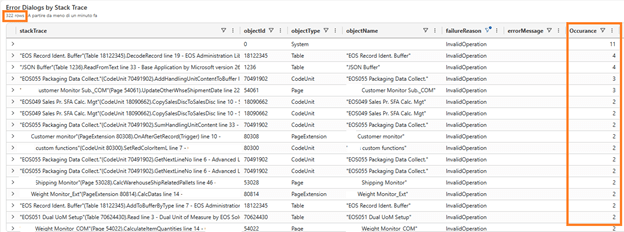
Very different ones. The only thing they have in common is that they are manipulating records (insert, update and/or delete). Aside from that, nothing more could be observed. It should not be an application issue, here, but a platform-related one.
Jeez… see how many details you could squeeze out from one single signal? Mind blowing.
Is this only related to this environment or to any other environment? I have checked 20+ environments upgraded to major version 26 and with different minor versions but found nothing. Not even a single signal to be observed with InvalidOperation. Only this one. The lucky one 😊. In any case, I gave green light to customer in update the environment from 26.1 to 26.3 in order to be on the latest bits.
After the upgrade, unfortunately, the client was still crashing like a scrambled egg. Darn…

What was the next step then?
I suspect this was a platform issue (if I would guess, it is in the server runtime jurisdiction area) hence I have created a support request to Microsoft.
Guess what? It was marked as platform inconsistency due to a specific race condition. A platform hotfix will be packed up and rolled out in the upcoming weeks. Probably fixed before the end of my customer due summer holidays.

If you are experiencing crashes due to InvalidOperation exceptions after upgrading to Dynamics 365 Business Central 2025 Wave 1, then probably you are hitting the same.
With the online version, you just wait few days to have the hotfix deployed through the typical pipelines (check component version greater or equal to 26.0.37691.0). If you are On-Prem with 26.x, most probably it will be part of Cumulative Update 5, planned to be released in the first week of September.

Now… Give my beer back!


Leave a comment