I always told my wife that love is simple. It is expressed in binary. Values are 0,1. You are in love, or you are not in love. You can’t be 0.73% in love. To me, she is 1.
And life? While love is simple, life is quite complex.
Stop being slimy, you stupid romantic, and get back to the meat: outliers.
Recently, I was looking at page views statistics and report to Microsoft a general performance regression in SaaS for a specific Dynamics 365 Business Central environment. We started focusing in one entry, just to be sure we were in the same line:
let _startTime = datetime(2024-12-01T10:43:44Z);
let _endTime = datetime(2024-12-09T11:43:44Z);
let _environmentName = 'ProductionIT';
pageViews
| where timestamp between (_startTime .. _endTime)
| where customDimensions.environmentName has_any (_environmentName)
| where customDimensions.alObjectId == "8903"
| where customDimensions.alObjectType == "Page"
| extend alObjectName = tostring(customDimensions.alObjectName)
| extend alObjectId = tostring(customDimensions.alObjectId)
    , eventId = tostring(customDimensions.eventID)
    , pageType = tostring(customDimensions.pageType)
    , environmentName = tostring(customDimensions.environmentName)
| summarize
    ExecutionCount = count(),
    avgTime = toint(avg(duration))
    by
    alObjectId,
    alObjectName,
    eventId,
    pageType,
    environmentName

They came back to me stating that it was not that bad during that period and the average time should have been lower than that, except for one exceptional event. And that is exactly where anomaly detection comes in hand.
Let me explain this very easily.
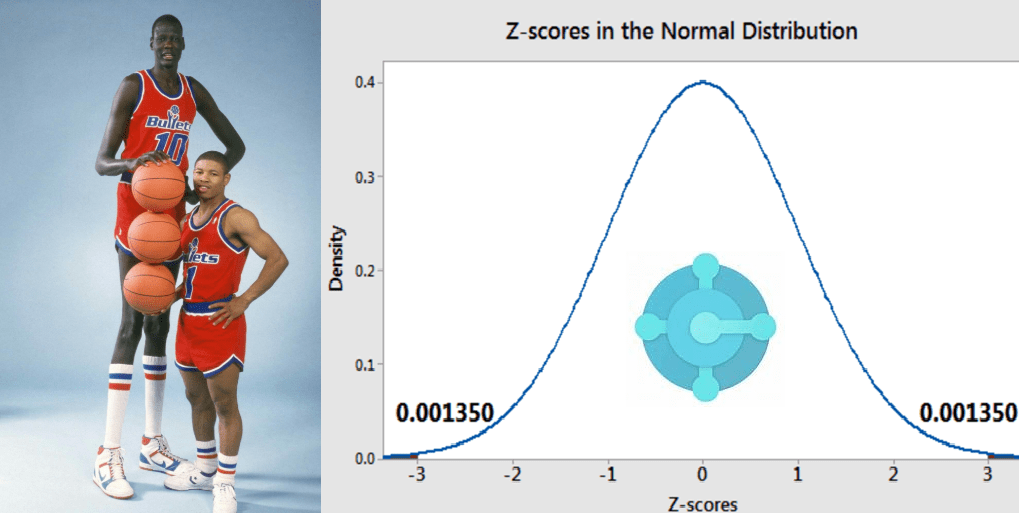
If you have 10 babies and 9 of them are 100 cm tall and just one is 200 cm. big boy, then the average is 110 cm. But 110 cm. does not depict correctly your population. They are all 100 cm., except 1. So… sorry, big boy, you are an outlier, considering the normal population distribution.
How could you define your population better and isolate outliers? Follow me in this magic kingdom and I will unlock the gates to another way to fit your data to reality.
First. Let’s add some more values, together with the average, to better define the data population: min, max and standard deviation to the previous KQL query:
| summarize
    ExecutionCount = count(),
    minTime = toint(min(duration)),
    avgTime = toint(avg(duration)),
    maxTime = toint(max(duration)),
    stdDev = round(stdev(duration),2)
    by
    alObjectId,
    alObjectName,
    eventId,
    pageType,
    environmentName

As you might notice, there is a range of values between 28 ms and 237 seconds. It seems to be quite broad and standard deviation is huge: 11K. I have already discussed about standard deviation in a previous blog post:
At this stage, THIS smells… no, THIS STINKS!
Now, is better to show off all values into a list in descending order:
let _environmentName = 'ProductionIT';
let _startTime = datetime(2024-12-01T10:43:44Z);
let _endTime = datetime(2024-12-09T11:43:44Z);
pageViews
| where timestamp between (_startTime .. _endTime)
| where customDimensions.environmentName has_any (_environmentName)
| where customDimensions.alObjectId == "8903"
| where customDimensions.alObjectType == "Page"
| project  alObjectName = tostring(customDimensions.alObjectName)
    , alObjectId = tostring(customDimensions.alObjectId)
    , eventId = tostring(customDimensions.eventID)
    , pageType = tostring(customDimensions.pageType)
    , environmentName = tostring(customDimensions.environmentName)
    , duration = toint(duration)
| sort by duration desc

There it is! Your unique big boy. The Manute Bol of your population.

Yes, BUT I cannot spend all the day sorting population and looking if there are outliers and pick them out.
Ah. Of course not. And it is exactly there that it comes in action the Z-Score.
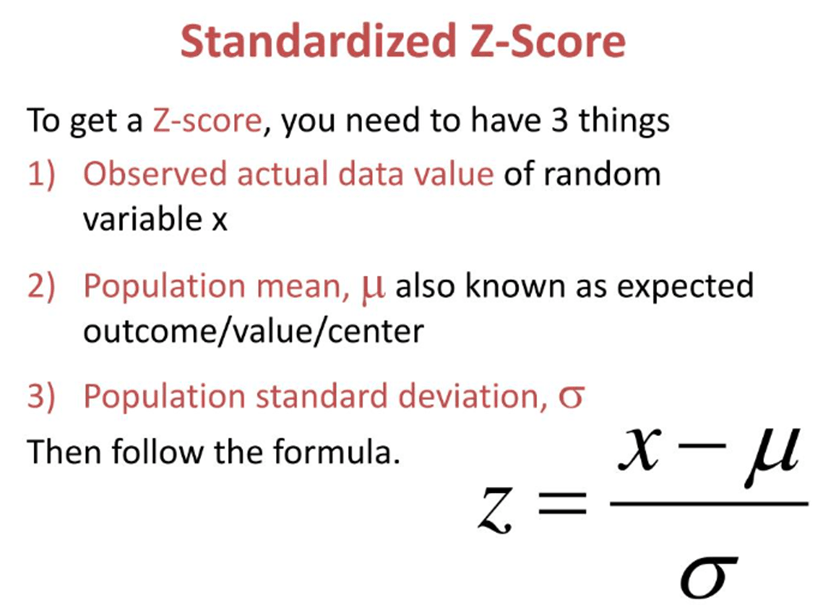
If you are scared by the math representation, this is very simple to calculate and looking at the diagram below, it is also easy to understand what it means and how it works.
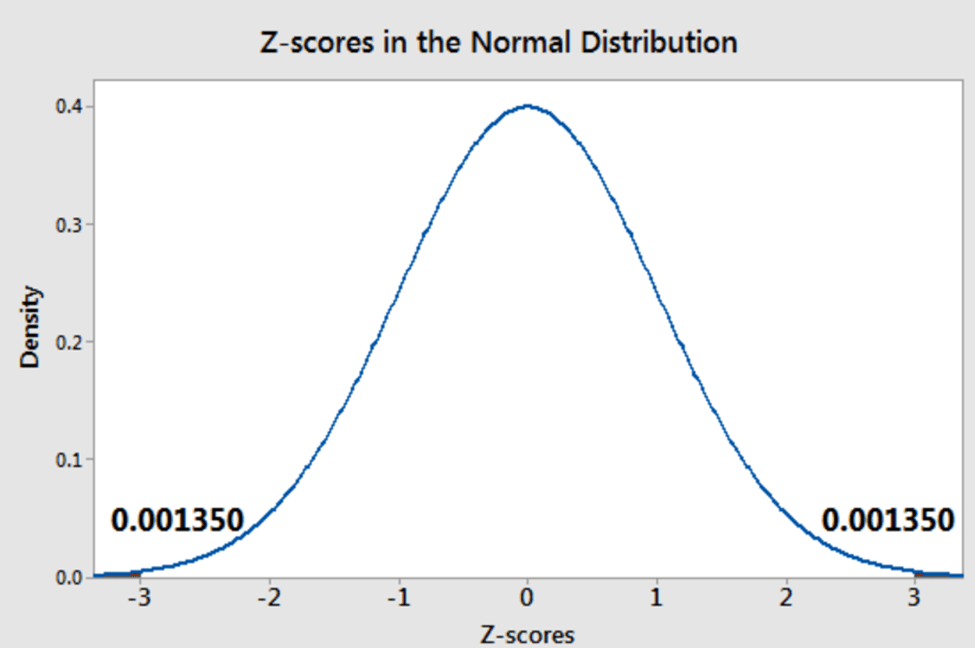
In a normal distribution, if you have an absolute Z-score value of 3 or higher, you have quite an outlier. The more you are close to zero, the better you are in the crowd of representative values.
Developers have typically a Z-score > 2.5
(because they do not love standing in the crowd).
C’mon it is just a joke! Smile, please…
I know, I know… You want to hear the end of the story. Coming back to Microsoft, I have calculated Z-score in my population:
let _environmentName = 'ProductionIT';
let _startTime = datetime(2024-12-01T10:43:44Z);
let _endTime = datetime(2024-12-09T11:43:44Z);
let stdDevArray =
(pageViews
| where timestamp between (_startTime .. _endTime)
| where customDimensions.environmentName has_any (_environmentName)
| where customDimensions.alObjectId == "8903"
| where customDimensions.alObjectType == "Page"
| extend alObjectName = tostring(customDimensions.alObjectName)
| extend alObjectId = tostring(customDimensions.alObjectId)
    , eventId = tostring(customDimensions.eventID)
    , pageType = tostring(customDimensions.pageType)
    , environmentName = tostring(customDimensions.environmentName)
| summarize
    ExecutionCount = count(),
    minTime = toint(min(duration)),
    avgTime = toint(avg(duration)),
    maxTime = toint(max(duration)),
    stdDev = round(stdev(duration),2)
    by
    alObjectId,
    alObjectName,
    eventId,
    pageType,
    environmentName
);
let arrayWithOutliers =
(pageViews
| where timestamp between (_startTime .. _endTime)
| where customDimensions.environmentName has_any (_environmentName)
| where customDimensions.alObjectId == "8903"
| where customDimensions.alObjectType == "Page"
| project  alObjectId = tostring(customDimensions.alObjectId)
    , alObjectName = tostring(customDimensions.alObjectName)
    , eventId = tostring(customDimensions.eventID) // note that this is different from other signal
    , pageType = tostring(customDimensions.pageType)
    , environmentName = tostring(customDimensions.environmentName)
    , duration = toint(duration)
);
arrayWithOutliers
|join kind=leftouter stdDevArray on
$left.alObjectId == $right.alObjectId,
$left.alObjectName == $right.alObjectName,
$left.eventId == $right.eventId,
$left.pageType == $right.pageType,
$left.environmentName == $right.environmentName
| project-away alObjectId1, alObjectName1, eventId1, pageType1, environmentName1
| extend Zscore = abs(round( (duration - avgTime) / stdDev ,2))
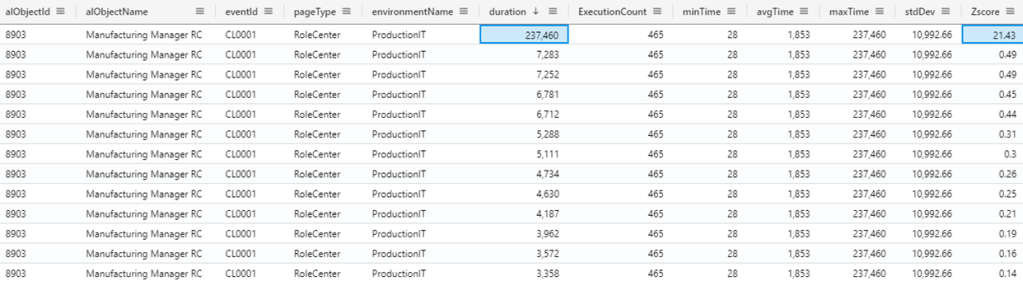
The Z-score will immediately highlight the outlier (Z-scorre = 21.43).
Hence, if you apply a filter to the previous KQL query that will remove the outlier(s), then your data population will look more adherent to reality and your average respecting more what you could hear from users:
| where Zscore < 3
| summarize
    ExecutionCount = count(),
    minTime = toint(min(duration)),
    avgTime = toint(avg(duration)),
    maxTime = toint(max(duration)),
    stdDev = round(stdev(duration),2)
    by
    alObjectId,
    alObjectName,
    eventId,
    pageType,
    environmentName

And 1.3 seconds is more what users are experiencing during the day.
Back to the first example with babies, it is like not considering the big boy, hence the average is 100 cm.
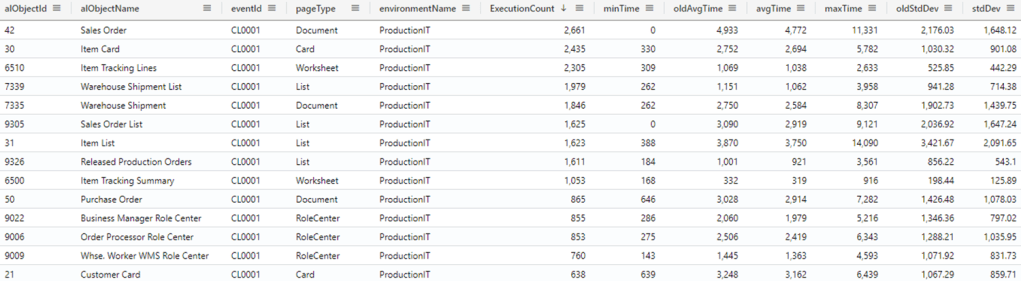
If you extend the same to ALL pageViews, you might have a better view on your data. See old and normalized values for average and standard deviation:
Good. Is it over? Yes. And No.
Yes. Now you have a better shape of which duration are experiencing your users, in a normal distribution.
No. Imagine that you have not one single outlier but 2 or 3 or even more. The outliers are the speciale ones and they need to be analysed and kept under control and tight observation. Most of the times, you will be in need to find out the number, the timeline and, overall, the root cause of such outliers. But this is another story to tell.
MERRY CHRISTMAS TO YA ALL !!! See you in 2025
(XMas tree has been generated thanks to this freaky KQL query: https://github.com/rod-trent/AddictedtoKQL/blob/main/Examples/ChristmasTree.kql )

Leave a comment