When working with On-Premises (that is “still a thing” – for some/many -), you have a full control and responsibility for the backend. This implies that you have full access to the database and use, for example, SQL Server Profiler to take very detailed traces on what is happening during a specific period.
What about Online version? There is not such a tool
BUT
when telemetry looks at you and asks, “do you have any other questions for me…?”

You can reply “… Excuse me, I didn’t dismiss you. I am not through my examination. Sit down!”

So, please, take a seat, telemetry.
Yes. There is one way to send ALL SQL statement executed for a given period and specific session, enabling verbose telemetry.
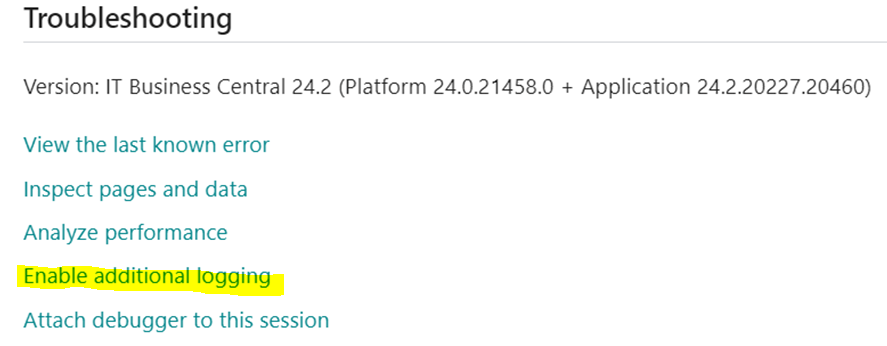
To enable Verbose Telemetry for a specific session, you simply have to go to Help & Support in the Web Client, scroll down to the Troubleshooting section and click on “Enable Additional Logging”

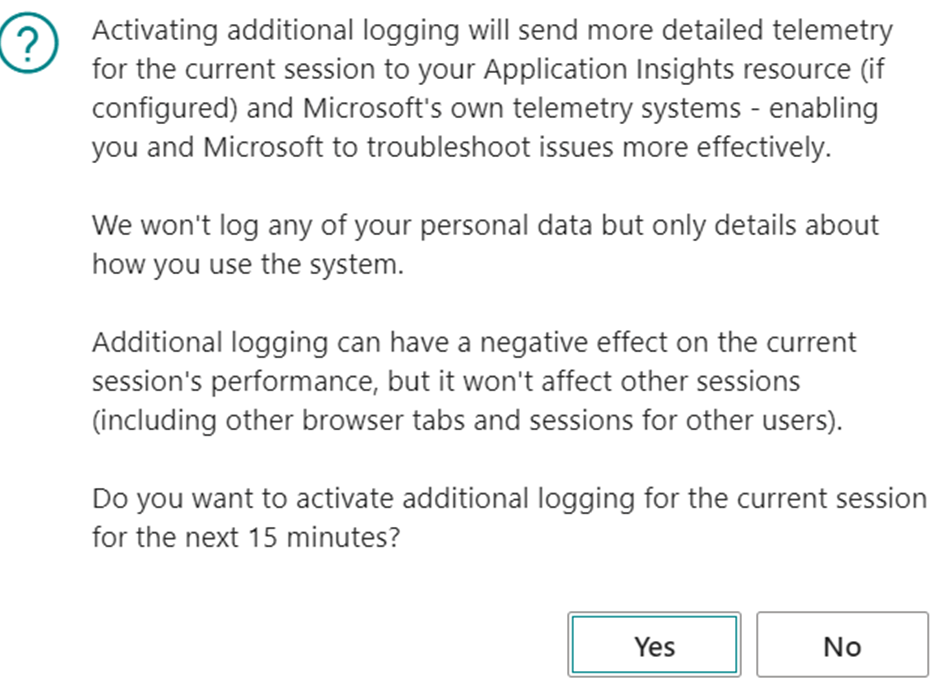
A pop up will appear with a (scary) warning that for the next 15 minutes there might be a situation:

And if you confirm, another (scary) pop up will appear with instructions on how to escape from this hell of a tracing.

So far, so good.
What Verbose telemetry will produce is very well described into the official documentation:

Ah, it also sends out Wait Stats signals, but these ones are not relevant – peanuts – within this blog post.
Rephrasing what is important and reported above: when you are enabling additional logging, telemetry signals are sent with the highest priority in order to let you troubleshoot almost Just In Time (JIT).
CAUTION! What is sent to the ingestion point is EVERY SINGLE SQL STATEMENT.
It is like in the Marines: “No SQL Statement will be left behind!”
This implies several (even hundred of) thousands of signals, depending on what are you doing and the sampling time, that have messages similar to the one below are sent over your ingestion point. And this could have an impact on the ingestion cost.
"timestamp": 2024-07-02T12:31:15.7791726Z,
"message": Executed a SQL statement.,
"severityLevel": 0,
"itemType": trace,
"customDimensions": {
    "clientType": "WebClient",
    "telemetrySchemaVersion": "0.5",
    "component": "Dynamics 365 Business Central Server",
    "componentVersion": "24.0.21271.0",
    "eventId": "RT0009",
    "aadTenantId": "Redacted",
    "environmentName": "Production_IT",
    "environmentType": "Production",
    "companyName": "Redacted",
    "extensionPublisher": "Microsoft",
    "alObjectName": "Item Jnl.-Post Line",
    "alObjectType": "CodeUnit",
    "sqlStatement": "INSERT INTO \"SQLDATABASE\".dbo.\"CURRENTCOMPANY$Item Application Entry$437dbf0e-84ff-417a-965d-ed2bb9650972$ext\" (\"Entry No_\",\"EOS051 Sec_ Quantity$7b5948a7-baa0-46fa-981d-cc17cab84143\") VALUES (@0,@1)",
    "alStackTrace": "AppObjectType: - "(CodeUnit 22).RunWithCheck (CodeUnit 59003)- SRI007 Production by EOS Solutions\r\n\"SRI007 Import Mes Entry\"(Report 59003).OnPostReport(Trigger) line 30 - SRI007 Production by EOS Solutions",
    "executionTime": "00:00:00.0010000",
    "extensionVersion": "24.2.20227.21214",
    "alObjectId": "22",
    "extensionId": "437dbf0e-84ff-417a-965d-ed2bb9650972",
    "extensionName": "Base Application"
},

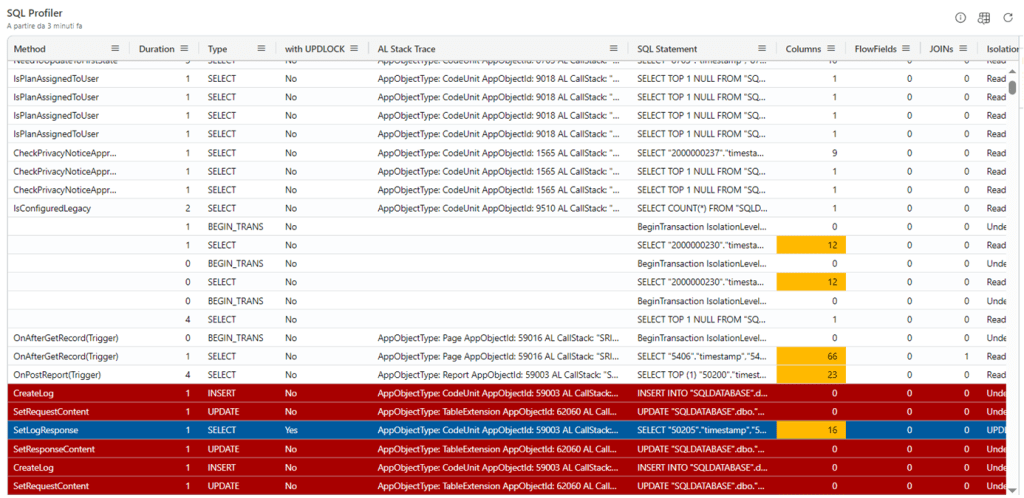
With a KQL query we could “simulate” the basic skeleton to mimic the On-Premise SQL Server Profiler. At least the query execution flow and its correlation with AL StackTrace.
// baseQuery bctraces
let bctraces = () {
    traces
    | where timestamp between (_startTime .. _endTime)
    | where customDimensions.aadTenantId has_any (_entraTenantId)
    | where customDimensions.environmentType has_any (_environmentType)
    | where customDimensions.environmentName has_any (_environmentName)
    | where customDimensions.companyName has_any (_companyName)
    | where customDimensions.clientType has_any (_clientType)
    | where customDimensions.extensionPublisher has_any (_publisher)
    | where session_Id has_any (_sessionId)
    | where user_Id has_any (_userId)
};
bctraces
| where message contains "Executed a SQL statement"
| extend duration = toreal(totimespan(customDimensions.executionTime))/10000
    , sqlStatement = tostring(customDimensions.sqlStatement)
    , alObjectType = tostring(customDimensions.alObjectType)
    , alObjectId = tostring(customDimensions.alObjectId)
    , alObjectName = tostring(customDimensions.alObjectName)
    , alStackTrace = tostring(customDimensions.alStackTrace)
| extend operationType = case(
    sqlStatement startswith "UPDATE", "UPDATE"
    , sqlStatement startswith "DELETE", "DELETE"
    , sqlStatement startswith "BeginTransaction", "BEGIN_TRANS"
    , sqlStatement matches regex "INSERT INTO", "INSERT"
    , sqlStatement startswith "SELECT", "SELECT"
    , sqlStatement matches regex "IF EXISTS \\(SELECT (.*)\\) SELECT", "SELECT'"
    , sqlStatement has "SELECT NEXT VALUE FOR", "SELECT_SEQUENCE_VALUE"
    , sqlStatement has "SELECT @@SPID", "SELECT_SPID"
    , sqlStatement matches regex "(.*)WITH", "SELECT"
    , sqlStatement startswith "CREATE TABLE", "CREATE_TABLE"
    , sqlStatement startswith "ALTER TABLE", "ALTER_TABLE"
    , sqlStatement startswith "exec sp_rename", "RENAME_TABLE"
    , sqlStatement matches regex "(.*)DROP TABLE", "DROP_TABLE"
    , sqlStatement startswith "SET LOCK_TIMEOUT", "SET_LOCK_TIMEOUT"
    , sqlStatement has "sp_getapplock", "GET_APP_LOCK"
    , "UNKNOWN"
)
, withUPDLOCK = iff(customDimensions.sqlStatement has 'UPDLOCK','Yes', 'No')
, numberOfJoins = countof(sqlStatement, "JOIN")
, numberOfFlowFields = countof(sqlStatement, "OUTER APPLY")
| parse kind=regex sqlStatement with selectPart:string "FROM" rest:string
| extend numberOfColumnsSelected = case(
    operationType == "SELECT", countof(selectPart,",") + 1
    , operationType == "SELECT'", countof(selectPart,",") + 1
    , 0
)
, isolationLevel = case(
    sqlStatement has 'WITH(UPDLOCK)', 'UPDLOCK'
  , sqlStatement has 'WITH(READUNCOMMITTED)', 'ReadUncommitted'
  , sqlStatement has 'WITH(READCOMMITTED)', 'ReadCommitted'
  , sqlStatement has 'WITH(REPEATABLEREAD)', 'RepeatableRead'
  , 'Undefined'
)
| extend splitStacktrace = split(alStackTrace, "\n")
| extend lengthStacktrace = array_length(splitStacktrace)
| extend
    topOfStackline = tostring(splitStacktrace[2]),
    bottomOfStackline = tostring(splitStacktrace[lengthStacktrace - 1])
| extend topOfStackObjectName = extract('\\\"?([^\\\"]+)\\\"?\\([a-zA-Z]+ \\d+\\)', 1, topOfStackline)
| extend topOfStackObjectType = extract('\\(([a-zA-Z]+) \\d+\\)', 1, topOfStackline)
| extend topOfStackObjectId = extract('\\([a-zA-Z]+ (\\d+)\\)', 1, topOfStackline)
| extend topOfStackLineNumber = extract(' line (\\d+)', 1, topOfStackline)
| extend topOfStackExtensionName = case (
    isnotempty(topOfStackLineNumber), extract('line \\d+ - (.+) by', 1, topOfStackline),
    extract(' - (.+) by', 1, topOfStackline)
    )
| extend topOfStackPublisher = extract('.+ by (.+)', 1, topOfStackline)
| extend topOfStackWhatWasCalled = case(
    isnotempty(topOfStackLineNumber), extract('\\\"?[^\\\"]+\\\"?\\([a-zA-Z]+ \\d+\\).(.+) line', 1, topOfStackline),
    isnotempty(topOfStackExtensionName), extract('\\\"?[^\\\"]+\\\"?\\([a-zA-Z]+ \\d+\\).(.+) -(.+) by (.+)', 1, topOfStackline),
    extract('\\\"?[^\\\"]+\\\"?\\([a-zA-Z]+ \\d+\\).(.+)', 1, topOfStackline)
    )
| extend bottomOfStackObjectName = extract('\\\"?([^\\\"]+)\\\"?\\([a-zA-Z]+ \\d+\\)', 1, bottomOfStackline)
| extend bottomOfStackObjectType = extract('\\(([a-zA-Z]+) \\d+\\)', 1, bottomOfStackline)
| extend bottomOfStackObjectId = extract('\\([a-zA-Z]+ (\\d+)\\)', 1, bottomOfStackline)
| extend bottomOfStackLineNumber = extract(' line (\\d+)', 1, bottomOfStackline)
| extend bottomOfStackExtensionName = case (
    isnotempty(bottomOfStackLineNumber), extract('line \\d+ - (.+) by', 1, bottomOfStackline),
    extract(' - (.+) by', 1, bottomOfStackline)
    )
| extend bottomOfStackPublisher = extract('.+ by (.+)', 1, bottomOfStackline)
| extend bottomOfStackWhatWasCalled = case(
    isnotempty(bottomOfStackLineNumber), extract('\\\"?[^\\\"]+\\\"?\\([a-zA-Z]+ \\d+\\).(.+) line', 1, bottomOfStackline),
    isnotempty(bottomOfStackExtensionName), extract('\\\"?[^\\\"]+\\\"?\\([a-zA-Z]+ \\d+\\).(.+) -(.+) by (.+)', 1, bottomOfStackline),
    extract('\\\"?[^\\\"]+\\\"?\\([a-zA-Z]+ \\d+\\).(.+)', 1, bottomOfStackline)
    )
| extend SourceProcess = strcat(bottomOfStackWhatWasCalled , " - ", bottomOfStackObjectType, " ", bottomOfStackObjectId, " ", bottomOfStackObjectName, " (", bottomOfStackExtensionName, ")")
    , LockingObject = strcat(topOfStackObjectType, " '", topOfStackObjectName,"'")
    , LockingObjectId = tostring(topOfStackObjectId)
    , LockingObjectMethod = tostring(topOfStackWhatWasCalled)
    , LockingObjectExtension = tostring(topOfStackExtensionName)
| project timestamp,
    ["Extension Id"] = customDimensions.extensionId,
    ["Extension Name"] = customDimensions.extensionName,
    ["Extension Publisher"] = customDimensions.extensionPublisher,
    ["Extension Version"] = customDimensions.extensionVersion,
    ["Object Type"] = alObjectType,
    ["Object Id"] = alObjectId,
    ["Object Name"] = alObjectName,
    ["Method"] = topOfStackWhatWasCalled,
    ["Duration"] = duration,
    ["Type"] = operationType,
    ["with UPDLOCK"] = withUPDLOCK,
    ["AL Stack Trace"] = alStackTrace,
    ["SQL Statement"] = sqlStatement,
    ["Columns"] = numberOfColumnsSelected,
    ["FlowFields"] = numberOfFlowFields,
    ["JOINs"] = numberOfJoins,
    ["Isolation Level"] = isolationLevel
| sort by timestamp asc

And since you have ALL the query execution at hands, you can get a sneak peak of almost everything it is useful to be dissected like:
SQL Statement By Total Duration (and number of execution count)

AL Method / AL CallStack by SQL Total Duration (and number of execute count)

It is not over. You ain’t dismissed, Sir. Now, Can you handle the truth?

With Verbose telemetry “YES YOU CAN”. (or, at least, you can go VERY near).
What you can do, then, is – for example – to filter by Publisher to exclude Microsoft extensions (where you cannot do anything, sorry, not your business) or, better, include just your AppSource apps and/or Per Tenant Extensions (PTE) where you could FULLY optimize your code within a specific process, from a database access perspective.
This includes:
- SELECT with UPDLOCK
PURPOSE: use the appropriate IsolationLevel, if and where needed

- Number of Columns
PURPOSE: use Partial Records (SetLoadFields) if and where needed

- FlowFields
PURPOSE: are they really needed? How will be the duration with/without them? Any chances to substitute V-SIFT (if any) with IncludedFields instead?

- CalcSums with UPDLOCK
PURPOSE: make them with IsolationLevel as ReadUncommitted, the most of the time

- IsEmpty with UPDLOCK
PURPOSE: make them with IsolationLevel as ReadUncommitted, the most of the time

And if I have more pattern, I’ll add them. No need to say that this is now part of my Azure Data Explorer Dashboard.
And now, telemetry… You are dismissed!


Leave a comment