
That day.
When Legolas does not have more arrows to kill the uruk-ahis (from LOTR).
When you have no more counterspell in your mono-blue deck (from MTG).
That day when a service tier crash and you have no more clue what to look for, after a long troubleshooting, to get to a solution in a timely manner.
When it happened, SOMETIMES (but not always), it was leaving the following event in the Event Viewer Application log
Faulting application name: Microsoft.Dynamics.Nav.Server.exe, version: 23.0.17940.0, time stamp: 0x65d50166
Faulting module name: unknown, version: 0.0.0.0, time stamp: 0x00000000
Exception code: 0xc00000fd
Fault offset: 0x00007ffc5fe0acef
Faulting process id: 0x173c
Faulting application start time: 0x01daa7a0c2584499
Faulting application path: C:\Program Files\Microsoft Dynamics 365 Business Central\230\Service\Microsoft.Dynamics.Nav.Server.exe
Faulting module path: unknown
Report Id: a5f24262-a620-4679-adff-78fb3dc09e5d
Faulting package full name:
Faulting package-relative application ID:
And in the Event Viewer System log, WER information appears:
The Windows Error Reporting Service service entered the running state.
Followed by 2 timeout error logs:
A timeout (30000 milliseconds) was reached while waiting for a transaction response from the MicrosoftDynamicsNavServer$BC236 service.
And lastly the R.I.P. tombstone of the service
The Microsoft Dynamics 365 Business Central Server [BC236] service terminated unexpectedly. It has done this 3 time(s).
It is the day where you have collected all possible traces, dissected telemetry until the last bit, looked for windows update, recreated the service, deleted TMP files. Even offered your most vigorous chicken as sacrifice to the informatic supreme elemental. (NOTE: it is just a joke. no chickens nor developers have been the subject of a sacrifice. Still.).
It was still crashing. Randomly, with no special patterns. Sometimes after 1 hour, sometimes after 3 hours, sometimes after 15 minutes. Quite painful. In the meantime, users beg for a fast resolution…

Hold on. Looking twice, there IS one pattern: it crashes only during working hours. In the night, logs are white like a spouse.
It must be a user interaction that crashes the service.
How to isolate the activity in a real-life scenario where you have a lot of noise in the logs and clock is ticking?
TROUBLESHOOTING STEPS AND TAKEAWAYS
Well. We did it old-school: create N services and distributed the users (50+) per business process area, e.g. finance in NST1, warehouse in NST2, logistics in NST3, etc. It is way rude BUT it is efficient so, please, shut up and let me continue.
What we did next?…
Sit and wait for the prey. In silence. The hunt just started.
Steady… Steady… Here it comes.
Finance NSTx crashed.
A quick interview with the users and we have isolated one suspicious activity related to a report.
User and its activity were isolated in a so-called NST cage (an isolated NST/Web Server combo only for that specific user and report runs).
We could then repeat steadily the crash so that all users were safe to work and that procedure freezed. But still there is a potential danger that needs to be eradicated and we still ignore the real root cause.
That affected report was an AppSource app. Since we are strongly checking the quality of the apps from all their angles, it sounded strange – but everything could be -. We open up the customer repo and find out a Per Tenant Extension (PTE) subscribing to different codeunits related to the AppSource app.
Uninstalled that PTE, no more crash. mmm this is like playing poker. Someone’s bluffing.

So now, lessons learned and troubleshooting rule #1:
uninstall PTE and evaluate the results.
For us, it was not enough – ‘course -: PTE should NOT crash so miserably the service tier.
I would have expected a client crash or an actionable error but definitively not a NST liquifying that way.
We decided to go deeper in the hunt.
Deployed a copy of the database in a TEST environment, ran the report with PTE to simulate the crash: No crash. Simply an actionable error (for developers) stating there was an overflow in recursion related to a specific subscriber.

WHAT??? DAF***
Please allow me a vibrant mixed feeling related to this discovery. Why on earth it was not crashing??? Maybe OS is different? No. .NET Core version? No. Updates? No. Build? No.
Troubleshooting rule #2:
be sure to have the same config parameters.
Comparing the 2 CustomSettings.config files (the somewhat-working one in TEST and the crashing in PRODUCTION) there were several different parameters, so that I have changed all of them and reproduced the crash again.
GOOD. We are few inches from the real root cause. I can smell the flavor of success.
Removing all of them one by one (or a couple per trial), I have finally isolated the issue.
Crash is due to the following old – better say “ancient” – parameter: “EnableDebugging“

A bit of history of the “EnableDebugging” parameter.
This comes from NAV 2009 service tier WCF debugging. It is a very old stuff that has never been removed (do not know why, honestly). Going back 15 years, when 3 tier structure popped up with the Navision Service Tier (NST), it was launched without debugging capabilities and many good fellas asked to have something to understand how the business logic was processed server side.
Therefore, product group released the capability of running service tier in debug mode and with Visual Studio it was possible to attach to Microsoft.Dynamics.NAV.Server.exe process and debug it. See this Jurassic article here: Debugging in NAV 2009 – Microsoft Dynamics 365 Blog
It is obvious that this parameter should not be enabled anywhere since there are quite advanced debugging and troubleshooting capabilities (debugger, in-client designer, event recorder, snapshots, telemetry, magical crystal balls…) then WHY Microsoft still leaves this hanging fruit that could potentially cause damage?
This should be removed from the default customsettings.config, imho (and also totally removed in the bits. Nobody cries – I believe – if it would.).
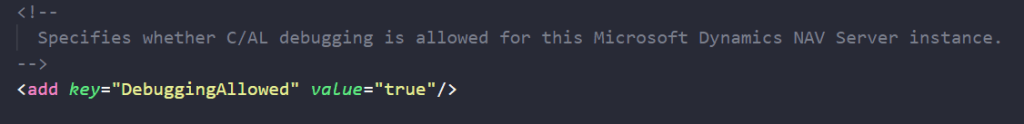
Together with EnableDebugging there is also another parameter called DebuggingAllowed, that could make some young peep to turn on/off the right parameter, thinking it is related to any modern AL debugging.
And if you still think it is useful: NOPE. This is related to old versions. Totally useless in the days. And it is also written in the short description “”… whether C/AL debugging…” (C/AL is dead. Amen to C/AL).
Therefore, these changes could be unintentional (but dangerous) and probably related to old and rusty PowerShell procedure adapted to migrate environments year after year.
CONCLUSION
Tattoo in your skin these 2 rules (instead of a boring mandala or birthday of your fiancée – this last one you might regret more then setting a wrong parameter, trust me -):
Rule #1: uninstall PTE and evaluate the results.
Rule #2: be sure to have the same config parameters.
Ah. Microsoft. Please, be sure to dismantle the code related to these 2 flags in the upcoming versions and remove them from the default config file (if possible), instead of leaving a charged gun in the toy box for the babies. 😉

Yikes! I knew one of the settings EnableDebugging/DebuggingAllowed was useful but both?!
Seems I have some settings to deactivate…
LikeLike
Bah, I meant useless NOT useful 🙈🤪
LikeLiked by 1 person