What is a time interval in telemetry? My son will answer “an interval of time”.
Ah ha. Boy, very funny. GO TO BED!!!
No, seriously. A time interval is characterized by a start (datetime) and an end (datetime). The difference between these is a timespan (a duration in AL-ish) calculated value. In short: if you have a start and an end datetime, you do not need a duration because it could be easily calculated.
Why am I bothering you with this stupid stuff? Because in Dynamics 365 Business Central, telemetry signals have been implemented in different waves by different teams. And within the same team, by different folks.
What’s the result? Signals are not standardized in names considering a start and an end in custom dimensions. Few examples in the meme below:

And the result is that we do not have a definition for a start datetime, and we must infer every time that timestamp being the end-time and calculate the start-time with a difference between timestamp and the duration of the event (or whatever Microsoft folks have called it in a signal).
Practically, this means that if you want to know what was running in a specific time frame, you cannot rely purely on timestamp BUT you must calculate the time interval, first, and after that, determine if this time interval overlaps with your specific investigation time frame.
A very basic and intuitive example: Report execution.
"timestamp": 2024-04-30T11:40:50.984822Z,
"customDimensions": {
	"eventId": "RT0006",
	"clientType": "WebClient",
	"componentVersion": "23.0.18873.0",
	"totalTime": "04:39:50.9489215",
	"result": "Success",
	"sqlRowsRead": "3764962",
	"sqlExecutes": "2948083",
	"serverExecutionTime": "04:39:50.9489215",
	"alObjectId": "18123472",
	"alObjectType": "Report",
	"alStackTrace": "AppObjectType: Report\r\n  AppObjectId: 18123472",
	"alObjectName": "EOS Calculate Actual Cost",
	"extensionPublisher": "EOS Solutions",
	"extensionName": "Inventory Valuation and Costing",
	"reportingEngine": "ProcessingOnly",
	"layoutType": "ProcessingOnly"
},
Report generation signal is emitted by the platform when it is finished (2024-04-30T11:40:50).
If this was running for e.g. “totalTime”: “04:39:50” and my investigation time frame was in-between the report was running, I won’t get anything out of telemetries using the typical
| where timestamp between (datetime(xxxx) .. datetime(yyyy))Like, for example,
| where timestamp between (datetime(2024-04-30T09:40:50.984822Z) .. datetime(2024-04-30T09:50:50.984822Z))In this case, I am forced to enlarge the time frame to inspect more.
Enlarging the time frame in real-life scenarios (read it: with a real solid traffic), might lead to a VERY large number of useless signals to be trapped in (so called noise signals). This kind of noise is something that you most probably want to avoid. Unless you have time to waste. (I don’t!).
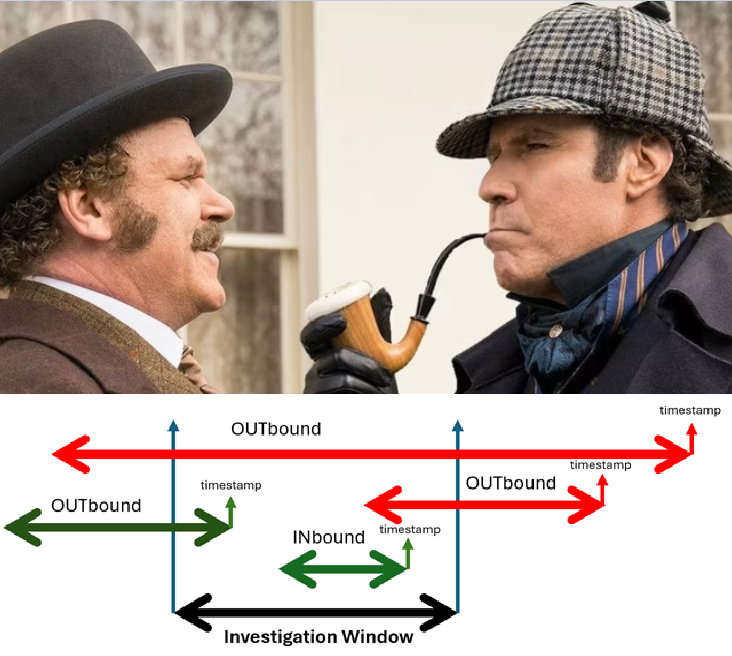
I would rather prefer to keep the investigation window very short and, viceversa, knows what’s included in that, with inbound AND ALL outbound timestamps (the red arrows, in the picture below).

For this reason, I have created my own dashboard page in Azure Data Explorer, containing separated relevant signals like:
- Long Running AL Methods (LRAM)
- Long Running SQL Queries (LRQ)
- Reports
- Job Queue
- Incoming WS
How do I calculate what was running? It is pretty simple – or sort of -.
- I am enlarging the analysis window of 12 hours, to be 100% sure to have everything captured before the longest timeout could happen.
let correctedEndTime = datetime_add('hour',12,_ToPeriodTime);
traces
| where timestamp between (_FromPeriodTime .. correctedEndTime)
- There it goes the tricky part. Calculate the correctedStartTime by adding (duration * -1), that is the equivalent of subtracting the execution time.
, executionTimeInMS = toint(round(toreal(totimespan(customDimensions.executionTime))/10000,0))
, negativeExecutionTimeInMS = toint((round(toreal(totimespan(customDimensions.executionTime))/10000,0)) * -1)
| extend correctedStartTime = datetime_add('millisecond',negativeExecutionTimeInMS, timestamp)
- Then it is safe to filter only the ones that have correctedStartTime inside the original upper bound of the investigation time window.
| where correctedStartTime <= _ToPeriodTime- And that should be it. I am also including a runningDuration, that is stating how long it was running that specific signal until ending into or hitting the upper bound of the investigation time window.
| extend runningDuration = iff(timestamp between (_FromPeriodTime .. _ToPeriodTime)
    ,toint(round(toreal(totimespan(timestamp - correctedStartTime))/10000,0))
    ,toint(round(toreal(totimespan(_ToPeriodTime - correctedStartTime))/10000,0)))
| sort by correctedStartTime asc
And below a typical result with highlighted in yellow the outer ones (Outbound).


Leave a comment