
This is for You. Yes, You. That at least once in a lifetime said, “It works on my machine”.
Ah. You haven’t? Are you sure?
LIAR!
Everybody has (and someone more than once in a lifetime) tested an application in a standalone all-in-one-environment for whatever reason. In this case, exactly
- the same platform
- the same application
- the same AppSource apps
- the same data pool (exported and imported via configuration package)
running in the famous “my machine” took 4 seconds while in Production SaaS environment took 11 seconds.
A bit of background. This is a very stretched scenario for a configurator app. What a configurator does? Let’s take a car, for example, given a specific base model, you can add different color, tires, engine, and several optional additions. From a base model, you could typically have 20 / 30 different parameters. More than 100 parameters it is quite difficult to find out in real life.
Well, in this case we have 2.000+ measures. A VERY stretched scenario for a configurator.
Telemetry stated that there is one long running AL Method that does 9.000 SQL Executes. No long running SQL Queries. Running a SQL Profiler trace on “my machine” (well, it was not really my machine, but you got the point – I know you do (liar!) -)

And suddenly everything was clear.
Dynamics 365 Business Central SaaS infrastructure is like Brad Pitt in Troy.

Beautiful, powerful, blessed, supercharged with AI (Achille’s Invincibility). But with a small point of weakness: latency. The Achille’s tendon.
I am just mumbling here. Why after 9 releases with telemetry, it has not been added the latency in any of the signals, nor collected in the snapshot debugger (very relevant in Production environments).
That looks strange to me. In the “old” days where you could use performance counters, anc collected the Heartbeat time.
| Heartbeat time (ms) | The time that it takes to complete a single write to a system table. Conceptually, this counter measures the time it takes to call the application database server to update the ‘last active’ field the dbo.Service Instance table for the Business Central Server instance. Every 30 seconds, the instance writes a record to indicate that the instance is “alive.” You can use this counter to indicate if there is network latency between the Business Central Server and the database. |
Well, I am not pretending to have ALWAYS a telemetry signal sent over every 30 seconds, but at least, something that could give an estimate of the latency worth to be added (overall for production environments). Probably the best candidate for a heartbeat is when enabling verbose mode in the client and send a signal every 30 seconds. Just a guess.
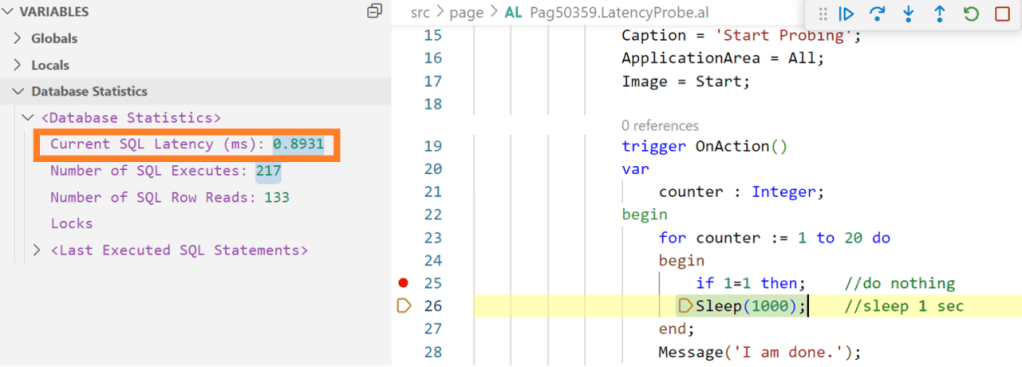
Currently, to my knowledge, the only way to somehow spot the different latencies is using the debugger against a sandbox environment (and thanks a ton to the Modern Development team engineer who have added that back in the days 😉):
| Current SQL latency (ms) | When the debugger hits a breakpoint, the server will send a short SQL statement to the database and measure how long it takes. The value is shown in milliseconds. |
But how this is working behind the scenes? Well, run a SQL Profiler trace and you will see it:
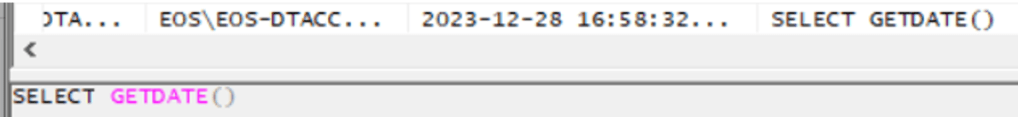
SELECT GETDATE is superfast and not a “pure” T-SQL query, this is the reason why it is considered as latency measurement between Azure SQL database and the Azure VM that is part of the regional cluster that holds the service tier that is currently issuing the request. Practically, a sort of ping between backend and NST.
Doing quite extensive tests in “my machine” and “my SaaS sandbox”, I have noticed a couple of interesting things:
- “My machine” has an average of 0.4ms latency with a very limited fluctuation of the values and rare spikes.
- “My SaaS sandbox” has an average of 1ms latency with a higher fluctuation of the values and frequent spikes.
This explained why the high number of SQL Executes took 4 seconds and 11 seconds, respectively.
CONCLUSIONS AND TAKEWAYS
Now you know one of the reasons why you shouldn’t test performance on “my machine” and explain to your customer why they should not compare local performance with SaaS once.
SaaS has been built-in as a series of services that scale independently (Azure SQL, Azure VMs, etc.) to cope with a modern cloud infrastructure. This “independence” has a cost called latency.
To minimize the effect of latency, it is important to avoid chattiness between NST and Azure SQL and reduce the number of SQL Executes as much as possible. And this is the current spirit to refactor the current part of the configurator code, to be more effective even in such stretched scenarios AND considering different latencies.
Tattoo well in mind that:
- In SaaS you might change the Azure VM where you are connecting quite frequently.
- When you upgrade or update, the Azure SQL database with your data is mounted to another NST in another cluster.
- Azure VMs and Azure SQL Database (in elastic pools or not, it does not matter) might change its latency due to maintenance, etc.
- When your upgrade or update fails, a Point In Time (PIT) restore is performed in a new database hence latency might change.

Leave a comment